blog

Slow internet is one of the most common and most fixable tech frustrations at home. Before you call your internet provider for tech support or upgrade your plan, it’s best to check your home network. Sometimes, your internet problems are caused by something in your house, like issues with your modem or router, device bottlenecks, or network settings, not your provider’s service.

With a little troubleshooting and a few adjustments, you can solve them quickly and easily. Here, we’ll cover the 15 most common reasons for slow internet, what is really going on in each case, and the fastest way to fix it. Start by running a speed test, then go through the list. Most people find the solution within the first few steps.

Key Takeaways

  • Slow internet is usually caused by device limitations, Wi-Fi setup issues, network congestion, or plan limitations. 
  • Running a speed test first helps identify whether the issue is inside your home or with your internet provider. 
  • Many slow internet problems can be fixed quickly without upgrading your plan. 
  • If fixes don’t help, your speed test results can indicate when it’s time to optimize equipment or upgrade service. 

What Causes Slow Internet?

Slow internet almost always falls into one of three categories: a device issue, a Wi-Fi setup issue, or a limitation on your internet provider’s side. Device issues include outdated hardware, too many apps running in the background, or a browser cache that’s grown too large to perform efficiently. Wi-Fi problems are usually caused by poor router placement, interference, or a router that’s overdue for a settings tune-up. Provider-side causes, like network congestion during peak hours, data caps, or throttling, are less common but worth ruling out, especially if the problem follows a consistent daily pattern.

Most of the time, the fix is easier than you think.

Run a Speed Test Before You Do Anything Else

Before you start troubleshooting, run a speed test and note your download, upload, and ping speeds. Running a speed test in a couple of ways can help you begin to identify slow internet problems.

Do two different speed tests; one wired via Ethernet and one wireless over Wi-Fi, while near the router. 

  • If the wired test results are within 10% or so of your internet plan speed, your internet connection is performing as it should.
  • If the speed results on the wired test are more than 10%-15% slower than your plan speed, then there’s likely an issue with your provider’s network. Check for outages or planned maintenance. If it doesn’t improve, contact your internet provider.
  • If the Wi-Fi test results are within 20% of your plan speed, your Wi-Fi is likely performing as it should. (Wi-Fi is always slower than wired due to the wireless hop and other connected devices.)
  • If the Wi-Fi speed test is more than 20% slower than your plan speed, you may have an issue with your Wi-Fi network, your device, or your router.
Slow Internet Has a Culprit. Let’s Find It.

Stop Guessing. Start Testing.

A speed test won’t fix slow internet, but it’ll tell you exactly what you’re dealing with before you waste time troubleshooting the wrong thing.

Diagnose My Connection Now

The 15 Reasons Your Internet Is Slow

1. Full Browser Cache and Cookies 

The first and easiest thing to check when you have a slow internet connection is your browser history. As you visit different websites, your browser automatically collects and stores data (cookies and cache). As this data accumulates, your browser requires more processing power to perform optimally, which can feel like lag.

How to tell if this is your problem: The slowness is isolated to your browser; pages load slowly or stall, but a speed test comes back normal, and other apps like streaming or gaming feel fine. The problem is also usually device-specific: if your laptop’s browser feels sluggish but your phone loads the same pages quickly, a full cache on the laptop is the likely culprit.

Quick Fix: 

  • Clear your entire browser history, including cookies and cached data, regularly, at a minimum of monthly, or weekly if you’re a heavy browser user.

2. Outdated Devices

Technology is always evolving, and older models are eventually phased out. Older phones, computers, or smart devices typically cannot support the speeds of modern networks, such as Gigabit internet. This can cause latency issues or connection drops, even if your internet plan is fast.

How to tell if this is your problem: The slow speeds are tied to one specific device; your newer phone or laptop connects fine, but an older computer, tablet, or smart TV consistently underperforms. If a speed test run on a newer device shows normal results while the older device tests significantly slower on the same network, the hardware is the bottleneck, not your connection.

Quick Fix: 

  • Check if your device needs a software update. 
  • If the device is very old, it may be time to upgrade to a newer model that supports modern Wi-Fi standards.
  • If you have cable internet, be sure that your modem and router are compatible with your internet provider’s service and that the modem’s version is at least DOCSIS 3.1. Many cable internet providers lease DOCSIS 3.1 modems or gateways.

3. Too Many Devices Using the Network 

All devices on a network share a finite amount of bandwidth. Your Wi-Fi router determines which devices need more, pulling from each to ensure all devices have some connection. Smartphone statistics show us just how many connected devices the average home has these days! Too many devices, and you risk overloading your equipment.

How to tell if this is your problem: Speeds feel noticeably slower when the whole household is online, during evenings or weekends when multiple people are streaming, gaming, or video conferencing at once, but feel faster when most people are away or devices are off. If your router’s admin page shows many connected devices, many of which you may not actively be using, that’s a clear signal the network is overloaded.

Quick Fix: 

  • Disconnect devices that aren’t currently in use.
  • Schedule high-bandwidth tasks (like large downloads) for later.
  • Prioritize essential devices (like your work laptop) in your router settings.

4. Background Applications Using Bandwidth 

Applications running in the background, such as automatic updates, cloud syncing services (e.g., iCloud or Dropbox), or even malware, can silently consume a significant portion of your bandwidth. This leaves less speed for the task you are actually trying to do.

How to tell if this is your problem: Your internet feels slow even though you’re only actively using one or two apps, or speeds suddenly drop in the middle of the day without any obvious reason. On Windows, opening Task Manager (Ctrl + Shift + Esc) and sorting by the Network column will often reveal a background process (a cloud sync, an OS update, or an antivirus scan) quietly consuming a large share of your bandwidth.

Quick Fix: 

  • Check your computer’s Task Manager (Windows) or Activity Monitor (Mac) to close unnecessary apps.
  • Schedule heavy tasks like system updates for off-peak hours.
  • Run a malware scan to ensure no malicious software is hijacking your connection.

5. Wi-Fi Network Is Public or Unsecured 

If your home network is publicly accessible without a password, anyone nearby can hop on. This is bad for two reasons: unauthorized users create congestion that slows your internet connection, and your network is left vulnerable to security risks.

How to tell if this is your problem: Log in to your router’s admin page (typically at 192.168.1.1 or 192.168.0.1) and look at the list of connected devices. If you see devices you don’t recognize (unfamiliar names, MAC addresses, or more connections than you’d expect), someone else is on your network. Unexplained slowdowns that seem to come and go at random, especially in an apartment building or densely populated area, can also point to unauthorized users.

Quick Fix: 

  • Add a strong password to your Wi-Fi network immediately.
  • Use WPA2 or WPA3 encryption for better security.
  • Check your router’s admin page to see which devices are connected and kick out any you don’t recognize.

6. Router or Modem Needs a Restart 

Like all electronics, your modem and router need regular maintenance and rest to function at peak capacity. If you’re experiencing internet speed problems, it may be your equipment signaling that it needs a break.

How to tell if this is your problem: Speeds have gradually gotten slower over days or weeks without any clear trigger and nothing has changed in your home setup, but performance has drifted downward. A restart often produces immediate and noticeable improvement. If your router’s uptime (visible in the admin panel under Status or System Info) shows it’s been running for 30, 60, or even 90+ days without a reboot, that’s a strong indicator that this is the issue.

Quick Fix: 

  • Restart your modem and router. This clears the device’s internal memory and refreshes the connection to your ISP.
  • Try to do this at least once a month.

7. Poor Router Placement 

Wi-Fi signals travel in waves and need room to disperse. If your router is shoved under a desk or tangled in cords behind a TV, you are actively blocking the signal. This is a very common reason for slow internet connections.

How to tell if this is your problem: Wi-Fi speeds improve noticeably the closer you get to the router, and drop off as you move away, especially once you’re on the other side of a wall or in an adjacent room. If moving your laptop or phone physically closer to the router produces a meaningful speed improvement on a test, placement is almost certainly a contributing factor.

Quick Fix: 

  • Move your router to a central, open location in your home.
  • Elevate it off the floor and keep it away from other electronics that might cause interference.
  • Avoid using unnecessary cable splitters in your network setup, as they can introduce signal loss and degrade performance, especially if multiple splitters are used in succession.

8. Furniture or Walls Block Wi-Fi Signals 

In addition to where you put the router, what surrounds it matters. Objects made of thick materials like wood, metal, concrete, and sheetrock are common barriers to a stable Wi-Fi connection.

How to tell if this is your problem: One specific room or area of your home consistently has poor Wi-Fi, even though other rooms closer to the router are fine. The problem is often worse for devices on a different floor than the router, or in rooms separated by a kitchen (which typically has metal appliances and tile that block signals heavily). Running a speed test in the weak room versus a room adjacent to the router will show a clear difference if obstructions are the cause.

Quick Fix: 

  • Rearrange furniture to clear the path between your router and your main devices.
  • Place the router on a higher shelf or table to help the signal travel over obstructions.

9. Home Is Too Large for Current Router 

Have you ever noticed that the farther away you are from your router, the worse your connection gets? Wi-Fi signals weaken over distance. If you have a large home, a single router might not be strong enough to reach every corner, creating dead zones.

How to tell if this is your problem: Some parts of your home have reliable, fast Wi-Fi while others consistently have a weak signal or drop the connection entirely, and the pattern roughly corresponds to distance from the router. A speed test run in the problematic room will show significantly lower speeds than one run near the router, even with no walls or obstructions in the path, because the signal simply doesn’t reach far enough at full strength.

Quick Fix: 

  • Invest in a Wi-Fi extender or a Mesh Wi-Fi system to boost the signal throughout your home.

10. Interference From Neighboring Wi-Fi Networks 

In densely populated areas, such as apartment complexes, your Wi-Fi might experience interference from your neighbors’ networks. This is often due to overlapping Wi-Fi channels.

How to tell if this is your problem: Wi-Fi feels noticeably slower or less reliable at home than in other locations, and the problem seems worse in the evenings when more neighbors are online. A free Wi-Fi analyzer app (WiFi Analyzer for Android or NetSpot for Mac and Windows) will show you a visual map of nearby networks and their channels; if a dozen networks are clustered on the same channel as yours, interference is likely the cause.

Quick Fix: 

  • Log in to your router settings and switch to a less crowded WiFi channel.
  • If you have a dual-band router, switch your devices to the 5GHz band, which is usually faster and less congested than the 2.4GHz band.

11. ISP Throttling Your Speeds 

While less common, your slow internet could be due to ISP throttling. This is when a provider intentionally slows your internet speed, often to manage network congestion or because of the specific activity you are doing.

How to tell if this is your problem: Speeds are consistently slow for specific activities, like streaming on Netflix or YouTube, buffers constantly, but web browsing and email feel normal. Or speeds drop noticeably after you’ve used a large amount of data in a billing cycle. The clearest test is to run a speed test with a VPN enabled and compare it to one without; if your speeds improve meaningfully with the VPN on, your ISP is likely throttling based on traffic type, because the VPN masks what kind of activity you’re doing.

Quick Fix: 

  • Use a VPN to hide your activity from your ISP, which can prevent content-based throttling.
  • Switch to a provider or plan that guarantees no throttling.

12. Hitting Bandwidth or Data Caps 

Some Internet Service Providers (ISPs) set limits on the amount of data you can use each month. Streaming data usage can add up quickly! If you exceed these caps, your ISP might significantly slow down your speeds or charge you extra.

How to tell if this is your problem: Internet speeds are dramatically slower than usual, often to the point of being barely functional, and the problem started abruptly rather than gradually, typically in the second half of your billing month. Log in to your internet provider’s account portal or app to check your current data usage; if you’re at or near your cap, that’s almost certainly the cause.

Quick Fix: 

  • Monitor your data usage regularly.
  • Upgrade to a plan with a higher data cap or, ideally, unlimited data.

13. Your Internet Plan Isn’t Fast Enough 

Sometimes the issue isn’t a glitch—it’s just that your usage has outgrown your plan. If you have added more people or devices to your home since you first signed up, your current bandwidth might not be enough. For example, do you know what is a good internet speed for Zoom? It might be higher than what you currently have.

How to tell if this is your problem: Everything on your network feels slow at the same time, it’s not isolated to one device, one app, or one room. A speed test confirms you’re actually receiving close to your plan’s advertised speed, but that speed simply isn’t enough for what your household is doing. If your plan is 50–100 Mbps and you have four or more people online simultaneously, the math doesn’t work regardless of how well your equipment is configured.

Quick Fix: 

14. Damaged or Outdated Cables 

Over time, the physical cables connecting your home to the internet (coaxial or fiber) can wear out or be damaged by weather or pests. This results in inconsistent speeds and frequent disconnections.

How to tell if this is your problem: Speeds are inconsistent rather than consistently slow; they fluctuate erratically, drop suddenly and then recover, or the connection drops out entirely and comes back on its own. This pattern of intermittent instability, especially when speeds are fine immediately after a restart but deteriorate quickly, often points to a physical-layer problem rather than a software or settings issue. Wiggling cables while watching the connection can also reveal intermittent physical faults.

Quick Fix: 

  • Inspect visible cables for kinks, frays, or chew marks.
  • Replace old Ethernet cables with newer Cat6 or Cat7 cables.
  • Contact your ISP to check the line coming into your house.

15. Using the Internet During Peak Hours 

Internet speeds often drop when everyone in your neighborhood gets online at the same time, usually in the evenings after work and school. This is known as “internet rush hour.” How internet traffic affects speed is a major factor for cable internet users in particular.

How to tell if this is your problem: Speeds are consistently slow at the same time every day, typically evenings and weekends, but feel noticeably faster in the morning or midday when fewer people in your area are online. Run a speed test during a slow period and again during an off-peak time like 7 AM; if there’s a significant gap between the two results and your in-home setup hasn’t changed, neighborhood congestion is the cause, not your equipment.

Quick Fix: 

  • Schedule high-bandwidth activities (such as downloading large game files) during off-peak hours.
  • If this happens constantly, consider switching to fiber internet, which is less susceptible to neighborhood congestion.

How to Optimize Your Router Settings for Better Speed

Once you’ve ruled out physical placement and interference issues, the next step is to check your router’s settings. Most people set up their router once and never touch it again, but a few targeted adjustments can improve speed, reduce lag, and make sure the right devices get priority bandwidth when you need it.

Set Up Quality of Service (QoS) to Prioritize What Matters

Quality of Service (QoS) is a feature built into most modern routers that lets you control which devices or activities get first access to your available bandwidth. Without it, your router treats all traffic equally. A scheduled cloud backup or a software update can compete with your video call or online game.

With QoS configured, you can tell your router to give video conferencing and gaming priority over large downloads or streaming, so the things that matter most get more bandwidth even when the rest of your household is online.

How to configure QoS:

  1. Access your router’s admin page. Open a browser and type your router’s IP address into the address bar (commonly 192.168.1.1 or 192.168.0.1). Log in to your router using the username and password (usually found on a sticker on the router itself).
  2. Find the QoS section. Look for a menu labeled “QoS,” “Quality of Service,” “Traffic Management,” or “Bandwidth Control.” The location varies by brand (e.g., Netgear, ASUS, TP-Link).
  3. Enable QoS if it isn’t already turned on.
  4. Create priority rules. Assign higher priority to applications like Zoom, Teams, or gaming clients, and lower priority to background tasks such as cloud backups, OS updates, or large-file downloads.
  5. Save and apply. Your router enforces the rules immediately, but you may need to restart it.

Quick Fix: If you regularly experience lag during video calls or gaming while other devices are active, enabling QoS is one of the most effective fixes without requiring a plan upgrade or new hardware.

Switch to a Less Crowded Wi-Fi Channel

Wi-Fi operates across a set of channels within each frequency band. In dense areas (apartment buildings, neighborhoods packed with routers) multiple networks often land on the same channel, causing congestion that slows everyone down. Your router may be defaulting to a heavily used channel without knowing it.

Most routers default to “auto” channel selection, which isn’t always optimal. Manually selecting a less congested channel can noticeably reduce interference and improve throughput.

How to find and switch to a better channel:

  1. Download a free Wi-Fi analyzer app (such as WiFi Analyzer on Android, or NetSpot on Mac/Windows). These show you which channels nearby networks are using.
  2. Identify the least crowded channel. On the 2.4 GHz band, channels 1, 6, and 11 are the only non-overlapping options; stick to one of these. On 5 GHz, there are many more non-overlapping channels to choose from.
  3. Log in to your router’s admin page and navigate to the wireless settings.
  4. Change the channel from “Auto” to your chosen channel and save.

Quick Fix: If neighbors are on channels 1 and 6, switch to channel 11. Even small channel adjustments can reduce dropped packets and improve consistency.

Use the Right Frequency Band for Each Device

Most modern routers are dual-band (2.4 GHz and 5 GHz) or tri-band (which adds a second 5 GHz or 6 GHz band). Understanding the difference and matching your devices to the right band are among the easiest free performance improvements available.

  • 2.4 GHz: Slower top speeds, but better range and wall penetration. Best for smart home devices, IoT gadgets, and anything located far from the router.
  • 5 GHz: Faster speeds, shorter range, less interference. Best for streaming, gaming, video calls, and laptops.
  • 6 GHz (Wi-Fi 6E routers only): The fastest option with the shortest range. Best for the latest devices that support it and are in the same room or nearby.

If your high-bandwidth devices (streaming sticks, gaming consoles, laptops) are defaulting to 2.4 GHz, you may be leaving significant speed on the table.

Quick Fix: Give your 2.4 GHz and 5 GHz networks different names (SSIDs) in your router settings, for example, “HomeNetwork” and “HomeNetwork_5G,” so you can control exactly which band each device connects to.

Know Your Router’s Wi-Fi Generation (And Whether It’s Holding You Back)

Wi-Fi standards have advanced significantly in recent years. If your router is more than five to six years old, it likely tops out at Wi-Fi 5 (802.11ac), and it can become a bottleneck even if your internet plan is fast and your devices are new.

  • Wi-Fi 5 (802.11ac): Fast for everyday use, but limited in how efficiently it handles multiple devices at once.
  • Wi-Fi 6 (802.11ax): Offers better performance in congested environments, improved battery efficiency for connected devices, and faster real-world speeds, especially in homes with many devices online simultaneously. Features like MU-MIMO (Multi-User, Multiple Input, Multiple Output) and OFDMA allow the router to communicate with multiple devices simultaneously rather than one at a time.
  • Wi-Fi 7 (802.11be): The latest standard, offering significantly higher throughput and lower latency. Most beneficial for power users, dense device environments, and multi-gig internet plans.

Quick Fix: You don’t need to upgrade just because a newer standard exists. But if your router is over 6 years old, you’re experiencing consistent slowdowns across multiple devices, and you’ve already tried the other fixes in this guide, a Wi-Fi 6 router is a worthwhile upgrade. Prices have come down considerably, and the real-world improvement in busy households is noticeable.

Enable Beamforming If Your Router Supports It

Older routers broadcast Wi-Fi signals in all directions equally, like a light bulb. Beamforming, available on Wi-Fi 5 and newer routers, allows the router to focus its signal toward specific connected devices rather than radiating it in every direction. The result is a stronger, more reliable signal for devices that need it, with less energy wasted on walls and empty rooms.

Beamforming is often enabled by default on routers that support it, but it’s worth checking. Log into your router’s admin panel, search for “beamforming” under wireless or advanced settings, and make sure it’s turned on.

Troubleshooting Only Goes So Far.

Sometimes the Fix Is a Better Provider.

If you’ve tried the fixes and your internet is still slow, the problem might not be your equipment. See which providers are available in your area and what they offer.

Compare Providers

What Your Slow Internet Is Telling You 

Most issues are fixable without switching providers. Often, a simple restart or moving your router can work wonders. Speed test results guide smarter decisions, helping you understand if the problem is your equipment or your service line. Understanding the cause prevents you from overpaying for a plan you don’t need or under-buying for a household that demands more power. 

FAQs About Slow Internet

Why is my internet slow even though my speed test is normal?

If your speed test looks fine but certain apps, websites, or devices feel slow, the problem is likely not your internet connection itself. The culprit is usually a specific device with too many background apps running, a browser cache that needs clearing, or a single app that’s hogging bandwidth. Try closing unused apps, clearing your browser history, and checking whether the slowness is specific to one device or affects everything on your network.

Why is my internet slow at night?

Internet speeds often drop in the evening because more people in your neighborhood are online at the same time, streaming, gaming, and browsing after work and school. Cable internet is especially susceptible to this because neighbors share the same local network infrastructure. If slow evenings are a consistent pattern, scheduling large downloads for off-peak hours (late night or early morning) can help, and switching to fiber, which is less affected by neighborhood congestion, is worth considering if it’s available in your area.

Why is my Wi-Fi slow in one room but not another?

Wi-Fi signals weaken with distance and struggle to pass through thick walls, floors, and dense materials such as concrete or brick. If one room consistently has a weak signal, your router is likely too far away, or something in between is blocking the signal. Moving your router to a more central location or adding a Wi-Fi extender or mesh node is usually the most effective fix.

How do I know if my ISP is throttling my internet?

A good sign of throttling is when your speeds are consistently slow for specific activities, like streaming or gaming, but normal for everything else. You can test for it by running a speed test with a VPN enabled and comparing the results to one without a VPN. If speeds improve with the VPN on, your ISP may be limiting traffic based on the type of activity, which is a known throttling method.

Will upgrading my internet plan fix slow speeds?

Not always, and upgrading is often the last thing you need to do. Many slow internet problems stem from router placement, outdated equipment, or too many devices competing for bandwidth, none of which a faster plan will fix. Run a speed test first and compare the results to your current plan; if you’re already getting close to what you’re paying for, the problem is inside your home network, not your plan tier.
If you’re reading this, you might be curious about how your internet connection stacks up against the rest of the country. From bustling cities to quiet rural towns, internet speeds vary dramatically across the U.S. Fast, reliable internet has become essential for everyday life, shaping everything from how we work and learn to how we stream movies and connect with family.

This guide will break down the latest data on internet speeds in the United States. We’ll define key terms such as download and upload speeds, reveal the states with the fastest and slowest connections, identify the top Internet Service Providers (ISPs), and explore the factors that cause these large performance differences.

Key Takeaways: Fastest Internet Speeds in the U.S.

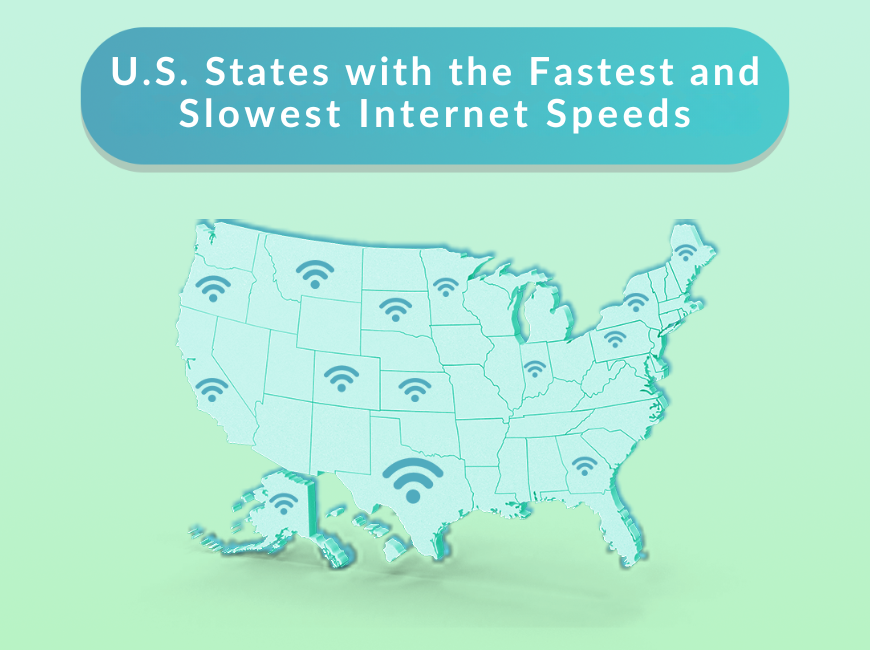
  • Fastest State: Delaware leads the nation with an average download speed of 246.95 Mbps.
  • Average Internet Speed in the U.S.: The U.S. median fixed broadband download speed is 308 Mbps as of early 2026.
  • Slowest State: Idaho has the slowest average internet speed in the US at 124.57 Mbps.
  • Fastest ISPs in the U.S.: Fiber providers like EarthLink Fiber, AT&T Fiber, and Google Fiber consistently deliver top speeds, with Xfinity being a leading cable provider.

National Internet Speed Ranking (Top 5):

  • Delaware (246.95 Mbps)
  • Maryland (238.26 Mbps)
  • New Jersey (235.67 Mbps)
  • Connecticut (233.88 Mbps)
  • Florida (232.80 Mbps)

Key Trend: The continued expansion of fiber-optic networks is the primary driver of increased average internet speed in the US, particularly in coastal and southern states.

Understanding Internet Speed: Download vs. Upload

Before we dive into the rankings, it’s helpful to understand what we mean by “internet speed.” Speed is typically measured in megabits per second (Mbps) and broken down into two numbers:

  • Download Speed: How quickly your device can retrieve data from the internet. It affects how fast websites load, videos stream, and files download.
  • Upload Speed: How quickly your device can send data to the internet. It’s important for video calls, online gaming, and uploading large files.

For most people, download speed is the more critical number, which is why it’s the primary metric used in this report.

The Average Internet Speed in the U.S. (2026 Overview)

In 2026, the average internet speed in the US is 309 Mbps. This represents a 59% increase from the 2024 average of 196 Mbps. These averages are calculated using data from millions of speed tests conducted by users across the country. Reputable sources like the Federal Communications Commission (FCC), Ookla, and M-Lab collect and analyze this data to provide a clear picture of the nation’s connectivity.

Internet Speed Rankings by State

While the national average is rising, performance varies significantly from state to state. Below is a comprehensive table of internet speed rankings for all 50 states, highlighting the vast differences in digital infrastructure.

RankStateAvg. Download Speed (Mbps)
1Delaware246.95
2Maryland238.26
3New Jersey235.67
4Connecticut233.88
5Florida232.80
6Virginia230.49
7Rhode Island227.10
8Texas225.74
9California223.59
10Nevada220.91
11Colorado219.79
12Massachusetts218.54
13Utah218.06
14New Hampshire217.06
15Oklahoma216.91
16Oregon209.69
17New York208.05
18Indiana206.46
19Tennessee205.07
20Pennsylvania204.66
21Louisiana203.11
22Illinois201.12
23Washington201.11
24Arizona200.64
25South Carolina199.35
26North Carolina197.61
27Missouri196.43
28Georgia194.98
29Arkansas194.82
30Michigan193.19
31Alabama191.88
32Ohio188.20
33Mississippi187.07
34Kansas186.88
35Kentucky183.31
36Wisconsin183.11
37DC182.39
38Nebraska177.37
39New Mexico173.62
40Maine173.23
41North Dakota171.03
42Vermont166.40
43West Virginia164.85
44South Dakota164.71
45Minnesota164.68
46Iowa150.74
47Wyoming147.19
48Hawaii146.07
49Montana129.73
50Alaska125.09
51Idaho124.57

TestMySpeed CTA banner, mint gradient background with a teal speedometer icon, an eyebrow line, a header about falling behind the national average, and two buttons: run a speed test and compare providers.

Falling Behind the National Average?

See which providers offer faster speeds at your address.

Falling behind the national average? Skip the test and see which providers offer faster speeds at your address.

The Fastest Internet Speeds in the U.S.

States with the fastest internet speed in the US are largely concentrated in the Northeast, where dense populations and strong competition among providers have fueled major infrastructure investments. These states benefit from extensive fiber optic networks, which deliver more reliable and faster connections than older cable or DSL technologies.

Top 5 States with the Fastest Internet:

StateAvg. Download Speed (Mbps)Most Common High-Speed Internet Type
Delaware246.95Fiber & Cable
Maryland238.26Fiber & Cable
New Jersey235.67Fiber & Cable
Connecticut233.88Fiber & Cable
Florida232.80Fiber & Cable

The Slowest Internet Speeds in the U.S.

On the other end of the spectrum, states with slower speeds are often more rural and mountainous. The high cost of laying fiber optic cables and the smaller customer base in these regions make it difficult for providers to invest in new infrastructure. This digital divide highlights a significant challenge for remote work, education, and economic growth in these areas.

However, government programs like the BEAD Program are working to close this gap by funding broadband expansion in underserved communities.

5 States with the Slowest Internet:

StateAvg. Download Speed (Mbps)Most Common High-Speed Internet Type
Idaho124.57Cable & DSL
Alaska125.09Cable & Satellite
Montana129.73Cable & DSL
Hawaii146.07Cable & DSL
Wyoming147.19Cable & DSL

What are the Fastest ISPs in the U.S.?

When it comes to providers, fiber optic internet is the undisputed king of speed. The fastest ISPs in the country leverage fiber technology to offer symmetrical download and upload speeds that can exceed 1,000 Mbps (1 Gbps).

  • National Fiber Leaders: Google Fiber, EarthLink Fiber, and AT&T Fiber are consistently ranked among the fastest providers nationwide. Their pure fiber networks offer superior performance and reliability compared to other connection types.
  • Top Cable Providers: While not as fast as fiber, cable internet from providers like Xfinity and Spectrum offers a widely available alternative with speeds that are more than enough for most households. Innovations like DOCSIS 4.0 technology are helping cable catch up, promising multi-gigabit speeds in the near future.
  • The Rise of 5G Home Internet: 5G home internet from providers like T-Mobile and Verizon is becoming a viable alternative, especially in areas with limited wired options. While speeds can be less consistent than fiber or cable, it’s an important technology for expanding broadband access.

What Impacts Internet Speed by State?

The disparity in internet speeds across states is not random. Several key factors contribute to why one state might have blazing-fast connections while another lags behind:

  • Fiber Availability: This is the single biggest factor. States with extensive fiber-to-the-home networks consistently have higher average speeds.
  • Population Density: It’s more cost-effective for providers to build and maintain networks in densely populated urban areas than in sprawling rural regions.
  • Competition and Investment: When multiple providers compete for customers in a market, it drives down prices and encourages investment in faster, better infrastructure.
  • Geography and Terrain: Laying fiber-optic cables across mountains, vast deserts, or remote islands is incredibly challenging and expensive, slowing deployment in states with difficult terrain.

Want to see how your own connection measures up? You can use a free tool like TestMySpeed to check your personal internet speed and compare it to your state’s average.

What’s Next for U.S. Internet Speeds

The future of internet in the U.S. looks bright and fast. We can expect the internet speed ranking to continue shifting as several key developments unfold:

  • Continued Fiber Expansion: With ongoing private investment and government funding, fiber networks will reach more communities, pushing the national average speed even higher.
  • Closing the Rural Divide: Initiatives aimed at bringing high-speed internet to rural and underserved areas will begin to narrow the digital divide, improving speeds in states that currently lag.
  • 5G Home Internet Growth: As the 5G network expands and matures, it will provide a competitive high-speed option for millions more Americans.

These trends suggest that by 2027, even more households will have access to the gigabit speeds needed to power our increasingly connected lives.

Frequently Asked Questions: Speeds by State

What is the average internet speed in the U.S. in 2026?

The average download speed in the U.S. is 309 Mbps as of early 2026. This is a significant increase over previous years, driven by the expansion of fiber-optic networks

Which state has the fastest internet speed in the U.S.?

Delaware has the fastest internet speed in the US, with an average download speed of 246.95 Mbps.

How can I check my internet speed and compare it to my state’s average?

You can use a free online speed test tool like TestMySpeed to measure your current download and upload speeds. You can then compare your results to the state averages listed in the table in this article.

Why is internet slower in some states?

Internet is slower in certain states primarily due to a lack of modern infrastructure, particularly fiber optic networks. Rural geography, low population density, and less competition among providers are major contributing factors.

What are the top 5 fastest ISPs in the U.S.?

While rankings can vary, the fastest ISPs are typically fiber providers. Google Fiber, EarthLink Fiber, AT&T Fiber, Verizon Fios, and Xfinity (as a top cable provider) are all considered among the fastest and most reliable options available.

Zoom doesn’t require much internet bandwidth; a single HD call uses as little as 1.8 Mbps. The minimum speed needed for a reliable work-from-home setup with multiple devices, plan for at least 25 Mbps download speed and 5 Mbps upload speed. The challenge is that your internet connection must handle Zoom and everything else on your network at the same time; other devices, streaming, downloads, and smart home traffic all compete for the same bandwidth.

So what’s actually a good internet speed for Zoom? It depends on how you use it. Below, we break down Zoom’s official bandwidth requirements by call type, explain why upload speed matters as much as download speed, and provide a practical baseline for different household sizes and use cases.

Got enough speed for Zoom and other users and activities?

Find the speed your household needs.

<50 Mbps

Great for individuals to browse the internet, check email, and other basic browsing.

50-100 Mbps

Great for streaming Netflix, videos, and online meetings.

100-200 Mbps

Great for streaming high quality videos, fast downloads, video games, and multiple devices.

200+ Mbps

Great for doing almost anything at ultra fast speeds.

Understanding Zoom’s Internet Speed Requirements

Zoom’s bandwidth requirements vary based on the kind of usage you have in mind. According to Zoom’s official recommendations, here are the minimum speeds by call type:

Call TypeQuality LevelDownload
(Mbps)
Upload
(Mbps)
1-on-1 video High-quality 0.6 0.6 
1-on-1 video HD (720p) 1.2 1.2 
1-on-1 video 1080p HD 3.8 3.0 
Group video High-quality 0.6 1.0 
Group video HD (720p) 1.8 2.6 
Group video 1080p HD 3.0 3.8 
Gallery view 25 participants 2.0 — 
Gallery view 49 participants 4.0 — 
Screen sharing No video thumbnail 0.05–0.075 0.05–0.075 
Screen sharing With video thumbnail 0.05–0.15 0.05–0.15 
Audio VoIP — 0.06–0.08 0.06–0.08 
Zoom Phone — 0.06–0.10 0.06–0.10 
Webinar attendee High-quality video 0.6 — 
Webinar attendee HD (720p) 1.2–1.8 — 
Webinar attendee 1080p HD 2.0–3.0 — 
Practical baseline WFH all-around 25 5 
Source: Zoom

While these are the official recommendations, we recommend that you have more bandwidth available to accommodate other devices and activities on your network.

Your camera’s fine. Your internet might not be.

Find out if your connection is killing your calls.

Before your next meeting freezes mid-sentence, run a speed test and know exactly where your connection stands.

Test my speed before my next call

Upload Speed for Zoom Calls 

Most internet plans are advertised by download speed, which is almost always the fastest. But with Zoom, upload speed is equally critical and far more likely to cause a frustrating experience.

When you’re on a Zoom call, your connection is doing two things at once: downloading the video and audio of other participants and uploading your own. If your upload speed is too slow, other participants see your video freeze or distort, even if your own screen looks fine. This is one of the most common problems with Zoom calls. 

Cable internet plans are particularly prone to this problem. A plan advertised as “500 Mbps” typically delivers that speed for downloads, while upload speeds may be as low as 10–20 Mbps. That’s still workable for a single Zoom call, but it can become a real constraint when: 

  • Multiple people in the household are on video calls simultaneously
  • You’re screen-sharing video or high-resolution content
  • You’re presenting as a webinar panelist, sending 1080p video

Latency and Jitter: The Hidden Culprits Behind Bad Zoom Calls 

Fast speed isn’t the only thing that determines Zoom call quality. Latency and jitter can significantly impact call quality and performance.

Latency (also called ping) is the time it takes data to travel from your device to Zoom’s servers and back, measured in milliseconds (ms). High latency causes a noticeable delay where you and another participant talk over each other because the audio arrives late.

Jitter is the inconsistency in that delay, and when latency fluctuates rapidly, audio and video arrive out of sequence, causing robotic-sounding voices, lip-sync issues, and stuttering video. 

For a smooth Zoom experience, aim for: 

Metric Acceptable Ideal 
Latency (ping) Under 150ms Under 50ms 
Jitter Under 40ms Under 20ms 
Packet loss Under 5% Under 1% 

You can check all three by running a speed test at TestMySpeed.com. Satellite internet tends to have high latency (600 ms+) even when download speeds are adequate, which is why it delivers a noticeably worse Zoom experience than cable or fiber, despite comparable speeds.

Fiber vs. Cable vs. DSL vs. Satellite for Zoom 

Not all internet connections are equal for video conferencing. Here’s how the main connection types compare specifically for Zoom use: 

Connection Type Typical Speeds Latency Upload Best For 
Fiber 200 Mbps–5 Gbps Very low (5–20ms) Symmetrical Power users, multi-person WFH households, 1080p calls 
Cable 100 Mbps–1 Gbps Low–moderate (15–40ms) Asymmetric (often 10–35 Mbps up) Most households; adequate for HD calls on single connections 
DSL 1–100 Mbps Moderate (25–50ms) Asymmetric (often 1–10 Mbps up) Light Zoom use; may struggle with simultaneous HD calls 
LEO Satellite  25–220 Mbps Low–moderate (20–60ms) Asymmetric (5–20 Mbps up) Rural users needing video calls; viable for HD Zoom with caveats 
GEO Satellite 25–150 Mbps Very high (600ms+) Asymmetric (3–10 Mbps up) Last resort only; latency makes real-time video calls noticeably painful 

Fiber is the best internet option for Zoom. Symmetrical speeds mean upload performance matches download, and low latency keeps calls tight and responsive. If fiber is available in your area, it’s the most reliable choice for video conferencing. 

Cable handles Zoom well for most users, but watch the upload speed. If your plan offers strong download speeds but weak upload, contact your ISP to check whether a higher upload tier is available without a full plan upgrade. 

DSL can work for basic 1-on-1 Zoom calls but is increasingly strained by modern video quality expectations. If you’re regularly running group calls or screen sharing on DSL, connection quality will likely disappoint. 

LEO (Low Earth Orbit) satellite is a good option for rural users who may lack access to other alternatives. Since LEO satellites orbit at roughly 550 km above Earth (vs. 35,000 km for GEO), latency is dramatically lower and well within Zoom’s workable range. Expect some variability during peak hours or adverse weather, but HD Zoom calls are consistently achievable. 

GEO (Geostationary) satellite remains a last resort for Zoom users. The physics of GEO are unavoidable: data must travel roughly 44,000 miles round-trip to a satellite parked in fixed orbit, producing latency of 600ms or more regardless of download speed. That delay makes real-time conversation noticeably awkward, with audio lag that no speed upgrade can eliminate. We recommend using audio-only mode if you’re on GEO satellite internet. 

Troubleshooting: Why Is My Zoom Freezing? 

If your Zoom calls are freezing, pixelating, or dropping unexpectedly, work through these steps in order before assuming you need a faster internet plan: 

1. Run a speed test first. Go to TestMySpeed.com and check your download speed, upload speed, latency, and jitter. Compare your results against Zoom’s requirements in the table above. If your speeds are well above minimums, the problem likely isn’t your internet connection; it’s your local network. 

2. Switch to a wired Ethernet connection. Wi-Fi introduces variability that a speed test won’t always catch. A direct Ethernet connection to your router eliminates interference, signal drop, and contention from other wireless devices. This single step resolves most Zoom call quality issues.

3. Close competing bandwidth applications. Video streaming, large file downloads, cloud backups, and software updates all compete for bandwidth during your call. Close or pause them before joining a meeting. 

4. Reboot your router. Routers accumulate memory and connection load over time. A simple reboot clears the cache and often restores full performance without any other changes. 

5. Adjust Zoom’s video quality settings. In Zoom’s settings, disable HD video if your connection is borderline, or limit the number of participants shown in gallery view. These tweaks meaningfully reduce bandwidth demand without ending the call. 

6. Check for network congestion. If calls are consistently worse in the evening, your ISP may be throttling speeds during peak hours. Run speed tests at different times of day to identify a pattern — if speeds drop significantly in the evening, contact your ISP or consider switching providers. 

7. Update Zoom and your router firmware. Outdated Zoom clients and router firmware are underrated causes of call instability. Check for updates on both before escalating to your ISP. 

The Ideal Internet Speed for Zoom

Zoom’s official minimum requirement for HD video is 1.2 Mbps for 1-on-1 calls and 1.5 Mbps for group calls. However, to ensure a strong Zoom experience, an internet speed of at least 10 Mbps is recommended, giving room for other network activities without reducing call quality.

Keep in mind that internet providers offer different speed levels that should be chosen based on individual internet usage and the number of devices on the same network. Before upgrading your internet plan, use the internet speed calculator below to help make a better-informed decision about your upgrade options.

Dropped frames. Frozen screens. Bad internet.

Don’t find out your internet is broken during the meeting.

TestMySpeed checks your connection in real time so you know whether your internet is Zoom-ready or just pretending to be.

Run a free speed test

Frequently Asked Questions: Internet Speed for Zoom

Is 10 Mbps enough for Zoom?

Yes, 10 Mbps is enough for a single HD Zoom call. But if you have multiple devices connected or run other bandwidth-intensive activities alongside Zoom, a minimum of 25 Mbps download and 5 Mbps upload is a more reliable baseline for most households.

How much upload speed do I need for Zoom?

For a standard HD group call, Zoom requires 2.6 Mbps upload. For 1080p group video, you’ll need 3.8 Mbps of upload speed. Cable internet commonly has much slower upload speed than download speed. If your Zoom video appears choppy to other participants but looks fine on your end, low upload speed might be the problem.

How much data does Zoom use per hour?

Zoom data usage varies by call type. A 1-on-1 HD call uses approximately 540 MB–1.62 GB per hour. A group HD call uses between 810 MB and 2.4 GB per hour. Turning off your video or limiting participants displayed in gallery view significantly reduces data consumption.

What internet speed do I need for Zoom on mobile or cellular?

Zoom automatically adjusts for 3G, 4G LTE, and 5G connections. For acceptable quality on mobile, a 4G LTE connection with at least 10 Mbps download is recommended. 5G connections are more than sufficient for HD mobile Zoom calls. On 3G or weak LTE signals, we recommend using audio-only mode.

What should I do if my internet speed is too slow for Zoom?

Start by running an internet speed test to confirm your current speeds. If speeds are below Zoom’s minimums, try connecting via ethernet instead of Wi-Fi, closing bandwidth-heavy apps, limiting other devices on the network during calls, or lowering your Zoom video quality settings. If problems persist, contact your internet provider or consider upgrading your plan.

Does Zoom use more bandwidth than Microsoft Teams or Google Meet?

Zoom and Teams have similar baseline requirements for HD calls (around 1.5–2.6 Mbps up/down). Google Meet requires slightly more for group calls (up to 3.2 Mbps). For most users the differences are negligible; connection stability and latency matter more than which platform you use.

Why does my Zoom keep freezing even with fast internet?

Fast download speed doesn’t guarantee a smooth Zoom experience. Freezing and dropped video are often caused by high latency, jitter, or network congestion rather than raw speed. A wired ethernet connection, router placement closer to your device, or a router reboot often resolves freezing issues that a speed upgrade won’t fix.

How many Zoom calls can I run simultaneously on one connection?

Each HD Zoom call requires approximately 1.8–2.6 Mbps upload and download speeds. On a 25 Mbps upload connection, you can theoretically run 8–10 simultaneous HD calls, though real-world performance will vary based on other network activity. For households with multiple remote workers or students, a plan with at least 100 Mbps download and 20 Mbps upload provides comfortable headroom.

Key Takeaways

  • Advertised speeds vs. reality: Internet providers advertise maximum speeds, but real-world results vary by connection type, time of day, and network congestion.
  • The best diagnostic tool: Running a speed test is the fastest way to confirm whether slow internet is caused by your home setup or your provider.
  • Know your metrics: Download speed, upload speed, and latency (ping) all impact performance differently.
  • Troubleshoot first: Many slow internet issues can be resolved by optimizing your equipment and Wi-Fi setup before upgrading your plan.
  • Next steps: If results stay poor after troubleshooting, consider upgrading hardware or switching connection types.

Internet providers advertise “up to” speeds, but what you actually get depends on your connection type, your equipment, and what’s happening on your network at any given moment. A speed test gives you the real number, and this guide helps you understand what it means. 

Use it to interpret your download speed, upload speed, and ping results; troubleshoot common performance issues; and decide whether it’s time to upgrade your plan or switch providers. 

What Is an Internet Speed Test?

An internet speed test is an application that measures how fast your internet is at that specific moment in time.

These tests generally measure the following key metrics:  

  1. Download speed: How fast you pull data from the web.
  2. Upload speed: How fast you send data to the web. 
  3. Ping (Latency): The reaction time of your connection.
  4. Jitter: The consistency of your latency, or how much it fluctuates. 

It takes less than a minute to complete. However, keep in mind that results can vary depending on your device (phone vs. laptop), your connection type (Wi-Fi vs. Ethernet), and even the time of day. 

You Got Your Results. Now What?

Run It Again. This Time, You’ll Know Exactly What You’re Looking At.

One test gives you a number. A second test gives you a pattern. Run another and actually understand what your connection is doing.

Re-Test My Speed Now

What Your Speed Test Results Mean

The numbers on your screen tell a story about your digital life. Here is how to read them. 

graphic explaining internet speed test metric results

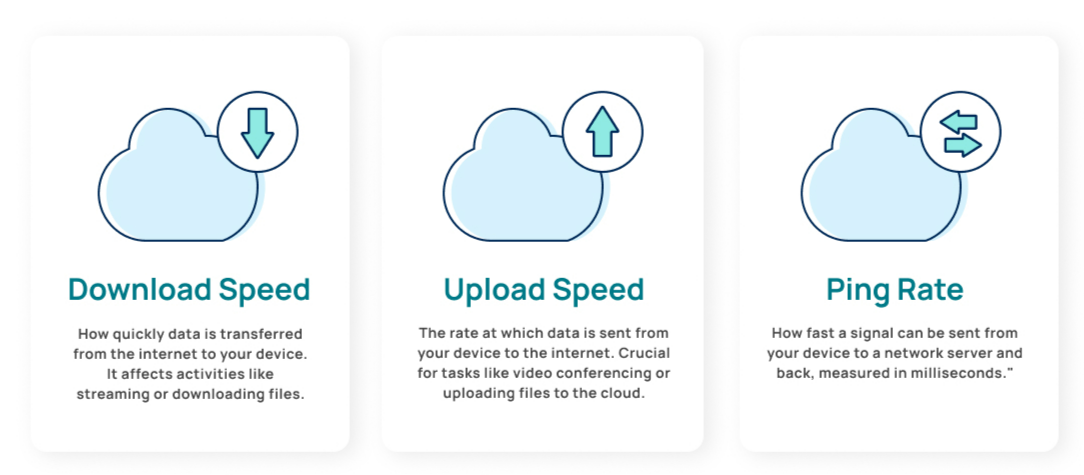
Download Speed

This measures how fast your device receives data. This is the metric that affects how quickly webpages load, how smooth your Netflix stream looks, and how fast you can download files. 

Performance Ranges: 

  • Poor (up to 99.9 Mbps): Struggle city. You might experience buffering on HD video and slow page loads.
  • Fair (100-199.9 Mbps): A reliable baseline for smaller households. Heavy multitasking or downloading large files may cause lag.
  • Good (200–499.9 Mbps): Good for most households. Supports HD streaming and general browsing for a few devices.
  • Very Good (500+ Mbps): Smooth sailing. Great for 4K streaming, large downloads, and multiple users.

Upload Speed

This measures how fast you can send data from your device to the internet. While often overlooked, upload speed is critical for video calls, backing up files to the cloud, and working remotely. 

Performance Ranges: 

  • Poor (up to 5 Mbps): Video calls may freeze or look grainy, and sending large email attachments will take a long time.
  • Fair (5-19 Mbps): Sufficient for standard Zoom calls and posting photos to social media.
  • Good (20-49 Mbps): Ideal for clear video conferencing, hosting livestreams, and managing standard cloud backups.
  • Very Good (50+ Mbps): Essential for large file transfers, professional content creation, and supporting multiple remote workers simultaneously.

Latency

Also known as latency, ping measures the reaction time of your connection—how fast a signal travels to a server and back. High ping causes “lag,” which is the enemy of responsiveness. 

Performance Ranges: 

  • Poor (100+ ms): Noticeable delays. You will likely experience internet lag, audio syncing issues (“talk-over”), and slow-loading web pages.
  • Fair (50 to 99 ms): Acceptable for most browsing and streaming on Netflix. However, you might notice slight delays in fast-paced games or occasional hiccups in video calls.
  • Good (20 to 49 ms): Perfectly responsive for almost all activities. You can game, stream, and video chat without noticeable delay.
  • Very Good (up to 19 ms): Instant response. This is the gold standard, essential for competitive gaming, professional trading, and seamless real-time interactions.

Jitter 

Jitter measures how consistent your latency is from moment to moment. While ping tells you the average reaction time of your connection, jitter measures how much that reaction time varies. Even with a decent ping, high jitter causes stuttering video calls, choppy audio, and unpredictable lag in online games. 

Performance Ranges:

  • Poor (30+ ms): Noticeable instability. Video calls will stutter or freeze, VoIP calls may sound robotic, and online games will feel inconsistent even if your ping looks acceptable.
  • Fair (15–29 ms): Manageable for most browsing and streaming, but you may notice occasional hiccups during video calls or in fast-paced multiplayer games.
  • Good (5–14 ms): Reliable for gaming, video conferencing, and streaming without noticeable interruption.
  • Very Good (under 5 ms): Rock-solid consistency. Ideal for competitive gaming, professional video calls, and real-time applications where stability matters as much as speed.

Types of Internet Connections and Their Impact

Internet connection types significantly influence the outcomes of speed tests. Each type has unique characteristics that affect speed, reliability, and overall performance:

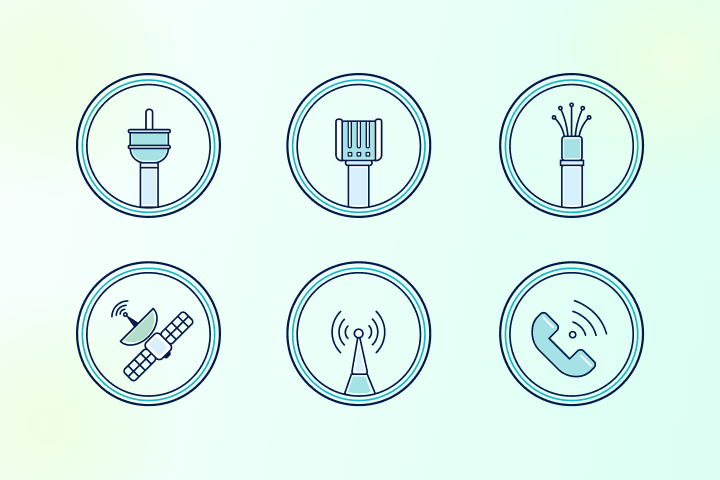
Fiber

  • Typical speeds: 300 Mbps–5 Gbps
  • What to expect: Fiber uses light signals to transmit data. It usually scores the highest on speed tests, offering symmetrical upload/download speeds and very low ping.
  • Verdict: The gold standard for speed and reliability.

Is fiber available in your area? Check availability and compare providers easily. 

Cable

  • Typical speeds: 100 Mbps–1 Gbps
  • What to expect: Uses coaxial cables (like those for TVs). It is fast and reliable, but uses a shared network. You might see speed test results dip during peak hours (evenings) when your neighbors are all online.
  • Verdict: A strong balance of speed and availability.

5G Home Internet 

  • Typical speeds: 100 Mbps–1 Gbps
  • What to expect: 5G Home Internet delivers broadband wirelessly over a cellular network. Speed test results vary based on tower proximity, network congestion, and local 5G band availability. Upload speeds are typically lower than download speeds.
  • Verdict: A compelling cable alternative where 5G coverage is strong, but speeds and reliability can be inconsistent.

DSL (Digital Subscriber Line)

  • Typical speeds: 10–150 Mbps
  • What to expect: DSL uses phone lines and is widely available, but speeds drop the further you are from the provider’s hub. On a speed test, expect higher latency than fiber or cable.
  • Verdict: Good for browsing and basic streaming, but often struggles with heavy loads.

Satellite

  • Typical speeds: Varies widely, up to 150 Mbps (GEO); up to 250 Mbps (LEO)
  • What to expect: Vital for rural areas, but signals have to travel to space and back. This results in naturally high latency (ping) on speed tests, even if download speeds are decent. Low Earth Orbit (LEO) satellite internet is faster and has lower latency due to its lower orbit compared to geostationary equatorial orbit (GEO) satellite internet.
  • Verdict: Essential for remote locations, though weather can impact stability.

Comparing Internet Connection Types At-A-Glance

Connection Type Avg Download Speed Avg Upload Speed Avg Latency Best For 
Fiber 500-1,000+ Mbps 500-1,000+ Mbps 10-20ms Gaming, streaming, work-from-home, multiple devices, large file transfers 
Cable 100-500 Mbps 10-50 Mbps 15-35ms Streaming, general browsing, households with moderate usage 
5G Home Internet 100-300 Mbps 20-50 Mbps 20-35ms Urban and suburban areas without fiber, renters, or households wanting an easy setup 
DSL 10-100 Mbps 5-20 Mbps 20-45ms Light browsing, email, single users with basic needs 
Satellite (GEO) 25-100 Mbps 3-10 Mbps 500-600ms Rural areas with no other options (avoid for gaming and video calls) 
Satellite (LEO) Urban and suburban areas without fiber, renters or households wanting easy setup 10-20 Mbps 20-50ms Rural areas, remote work, streaming (where cable and fiber are unavailable) 
Speeds and latency can vary significantly based on your specific provider, plan, location, and network congestion. Fiber offers symmetrical speeds (equal upload and download), while most other technologies have much lower upload speeds. 

Understanding Internet Provider Speeds

It is important to remember that ISPs advertise “up to” speeds. This is the maximum bandwidth delivered to your home under perfect conditions, usually via a wired Ethernet connection. 

Wi-Fi adds interference and distance variables, so wireless speed tests will almost always be lower than the advertised number. A “good” result is usually within 50–200 Mbps of your plan’s maximum (if you have a high-speed plan). If you are paying for 500 Mbps and getting 450 Mbps over Wi-Fi, you are in great shape. 

Reasons for Slow Internet

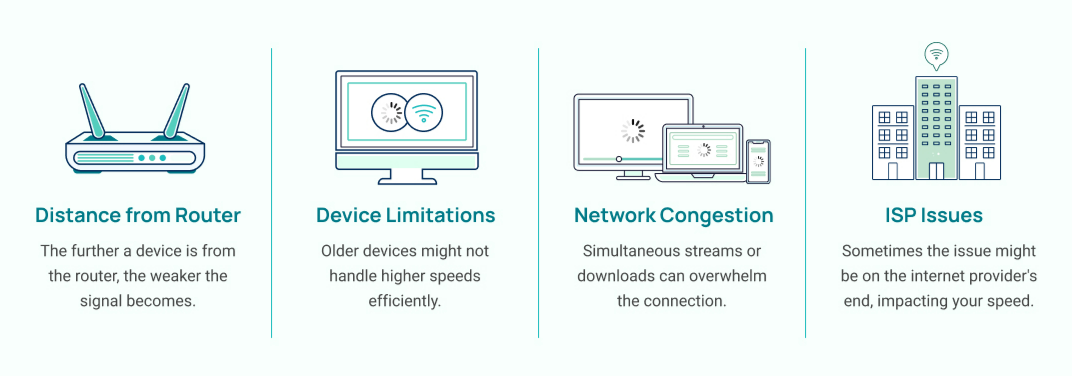
There are many reasons why you might be experiencing slower internet than normal. Here are the three most common reasons for slow internet that you can easily fix on your own in as little as 10 minutes.

graphic of factors that affect internet speed test results
  1. Router placement (10 min): Wi-Fi signals struggle to move through walls and metal. Move your router to a central, open location, elevated off the floor. For more on placement, see Reasons for Slow Internet.
  1. Restart modem/router (5–10 min): It’s a cliché for a reason. Restarting clears the memory and refreshes the connection. 
  1. Too many devices (5 min): Background downloads on idle tablets or consoles can hog bandwidth. 
  1. Wi-Fi interference (10–20 min): Microwaves and baby monitors can disrupt signals. Try switching your router channel via its admin settings. 
  1. ISP congestion: If tests are only slow at 8:00 PM, it’s likely network congestion. 

Find how much Internet Speed do you need

Your household may want faster internet speeds.

Up to 99 Mbps

Good for a single person checking email and basic browsing.

100-199 Mbps

Great for streaming HD video and standard work-from-home tasks.

200-499 Mbps

Ideal for families, gaming, and multiple devices streaming at once.

500+ Mbps

Power user territory. Necessary for 4K streaming, large file transfers, and smart homes with dozens of devices.

Advanced Troubleshooting Tips for Internet Speed

If the basics didn’t work, try these advanced steps: 

  • Update firmware: Check your router manufacturer’s app or website. Outdated software can throttle speeds.
  • Enable QoS: Quality of Service settings allow you to prioritize specific traffic (like your work laptop) over others (like the kids’ YouTube).
  • Test via Ethernet: Plug a computer directly into the modem. If the speed is fast there but slow on Wi-Fi, the issue is your router, not your ISP.

How to Run an Internet Speed Test

Testing your internet speed helps you determine if you’re getting what you’re paying for and whether it’s time to upgrade your plan. Go to TestMySpeed to run an internet speed test, then follow these steps for the most accurate results: 

1. Use an Ethernet Connection 

Connect your computer directly to your router with an Ethernet cable for the most accurate internet speed. This gives you a baseline for what your connection is capable of delivering. 

2. Test Your Wi-Fi Performance 

Run a separate speed test over Wi-Fi to see how your wireless network performs. Test from multiple locations: 

  1. First, test right next to your router 
  1. Then, test from rooms farther away where you typically use devices 

Significant speed drops indicate Wi-Fi coverage issues rather than problems with your internet connection itself. 

3. Minimize Network Activity 

Before testing, pause downloads, close streaming services, and ask others in your household to temporarily disconnect their devices. Other active connections can skew your results. 

4. Test at Different Times 

Run speed tests during both peak hours (evenings and weekends) and off-peak times (weekday mornings or late nights). If you notice significantly slower speeds during peak times, you may be experiencing network congestion from your ISP, which could indicate it’s time to consider a more robust connection type or plan. 

Your Results Are Only as Good as Your Last Test.

Fresh Test. Real Numbers. No Guesswork.

TestMySpeed gives you accurate, real-time speed data every time. What you see is exactly what your connection is doing right now, not an estimate.

Run a Free Speed Test

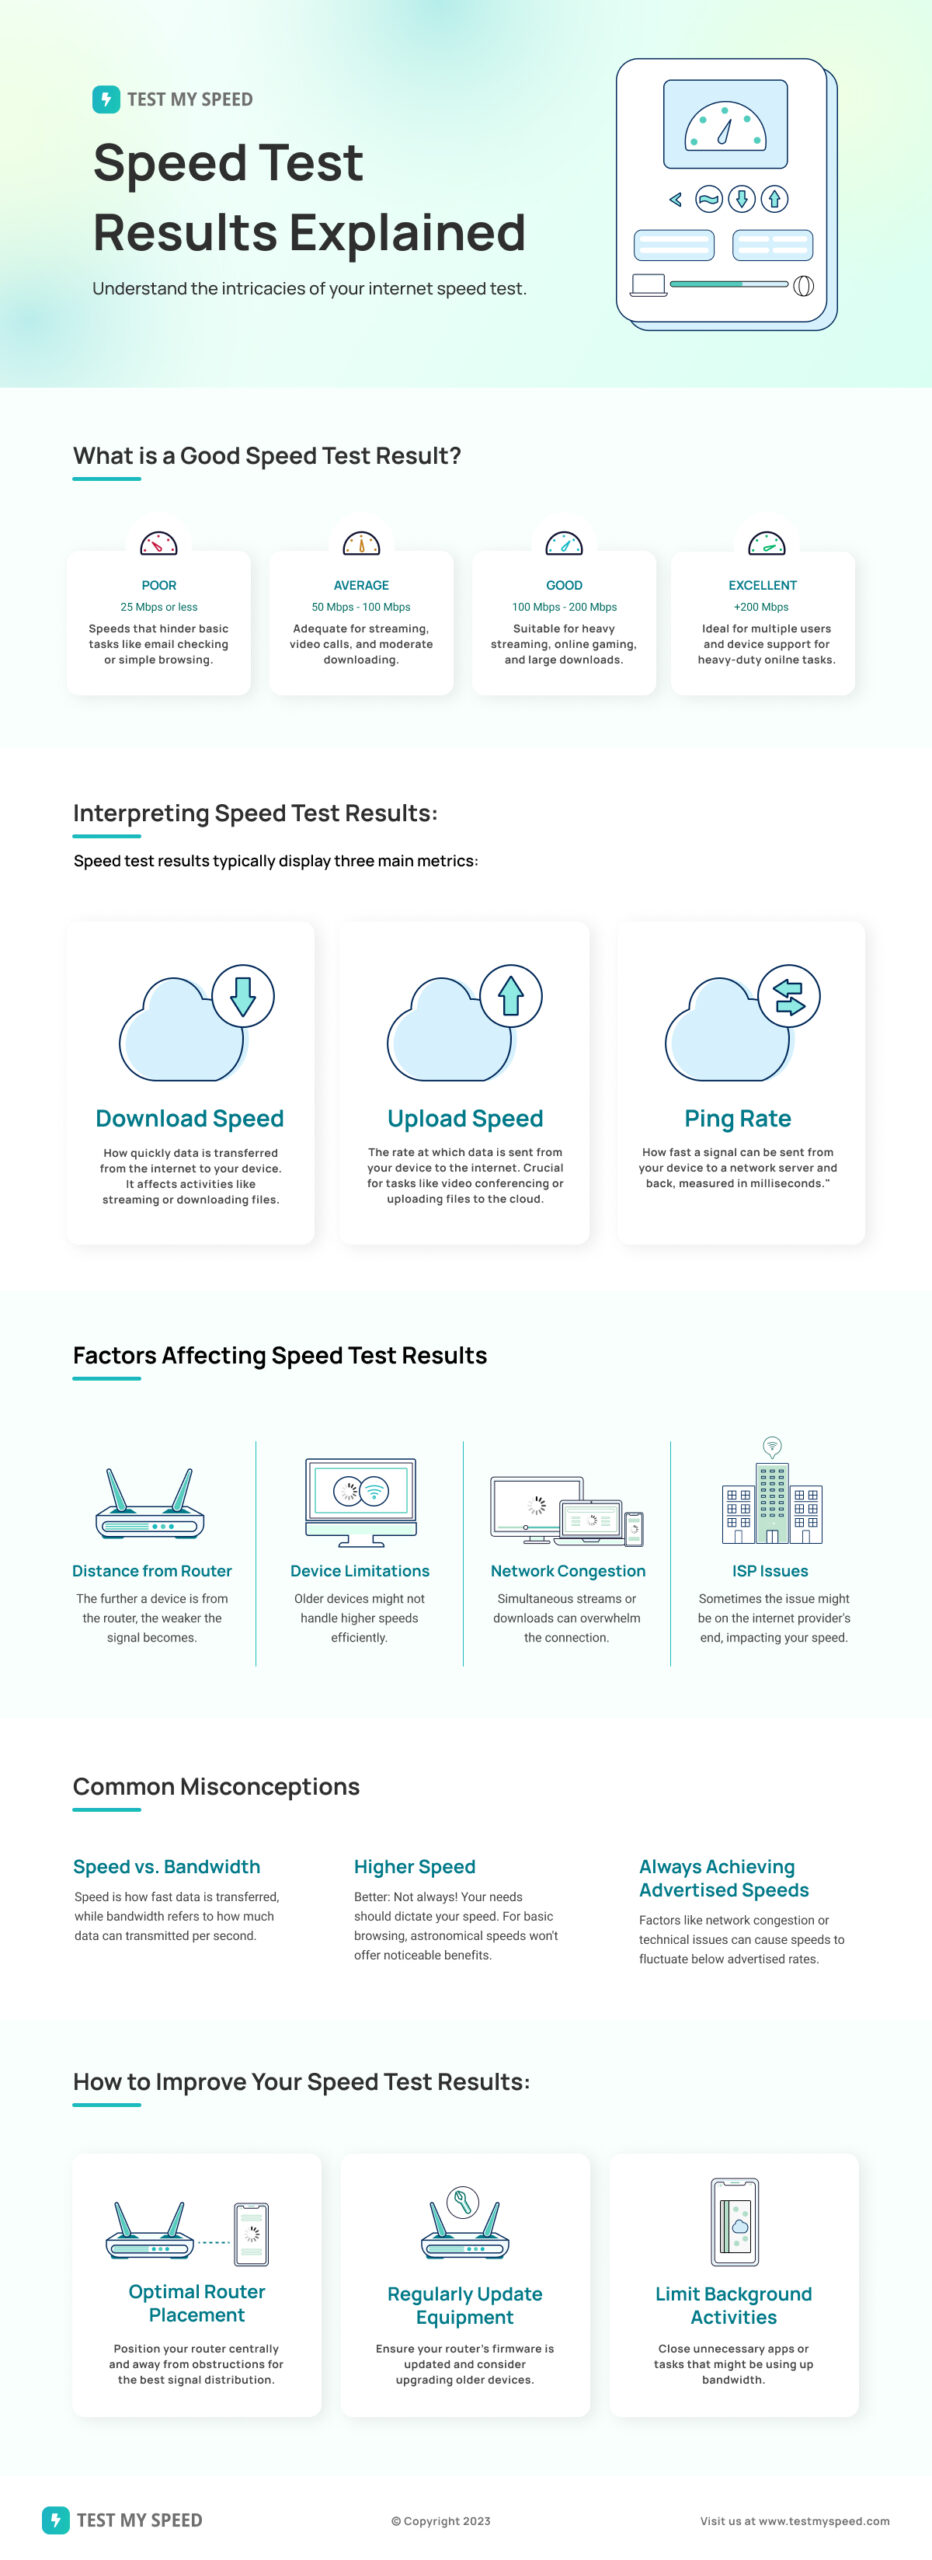
Infographic: Internet Speed Test Results Explained

testmyspeed.com understanding internet speed test results metrics infographic

What to Do After Your Speed Test

Running a speed test is just the first step. Once you know your numbers, you have real leverage to troubleshoot your setup, push back on your provider, or make a confident decision about upgrading your plan or switching connection types. 

Start with the basics: restart your router, test over Ethernet, and rule out Wi-Fi as the culprit. If speeds are still falling short after troubleshooting, check whether your plan matches your household’s actual needs. And if your provider consistently underdelivers, it may be time to explore other options in your area. 


FAQs: Understanding Internet Speed and Speed Tests

Why is my internet slower at night?

Evening hours (roughly 7-11 PM) are peak usage times when most people in your neighborhood are streaming, gaming, and browsing simultaneously. Cable and DSL connections are particularly susceptible to this network congestion because you share bandwidth with nearby users. Fiber connections typically handle peak times better due to higher capacity and interference resiliency.

Why is Wi-Fi slower than Ethernet?

Wi-Fi signals must travel through air and walls, losing strength and speed along the way, while Ethernet cables provide a direct, interference-free connection. Wi-Fi speeds are also affected by distance from your router, physical obstacles, other electronic devices, and the number of connected devices competing for bandwidth. For activities requiring maximum speed and stability, like gaming or large file transfers, Ethernet is always superior.

You can test for Wi-Fi dead zones in your home by running an internet speed test when you’re close to the router, then from the area(s) in your home that are farthest from it. If the speeds are significantly slower, you may want to consider Wi-Fi extenders or a mesh Wi-Fi system.

What is a good download speed?

For a single person doing basic browsing and streaming, 25-50 Mbps is sufficient. Households with 2-4 people streaming HD video, gaming, and working from home should aim for 100-200 Mbps. Larger families or those with multiple 4K streams and heavy usage need 300-500+ Mbps to avoid slowdowns.

What is a good upload speed for Zoom?

Zoom requires 3-4 Mbps upload speed for HD video calls, but you should have at least 10-15 Mbps upload to ensure stable performance, especially if others in your home are using the internet simultaneously. For hosting larger Zoom meetings or presenting with screen sharing, 20+ Mbps upload is ideal. Cable and DSL often struggle here due to lower upload speeds compared to fiber.

What is a good ping for gaming?

Under 20ms is excellent for competitive online gaming, 20-50ms is good for most gaming, 50-100ms is playable but may feel slightly laggy in fast-paced games, and anything over 100ms can cause noticeable delays. Fiber typically delivers the lowest ping, followed by cable, while satellite (especially GEO) is problematic for real-time gaming.

How many times should I run a speed test?

Run at least 3-5 tests and average the results, as individual tests can vary due to momentary network fluctuations. Test at different times of day (morning, afternoon, evening) over several days to get a complete picture of your connection’s performance. If results vary wildly, it may indicate inconsistent service that needs troubleshooting.

Is satellite internet always slower and laggier? (LEO vs GEO)

Traditional GEO (geostationary equatorial orbit) satellite is both slower and laggier due to signals traveling 22,000+ miles to space and back, resulting in 500-600ms latency that makes gaming and video calls frustrating. Modern LEO (low Earth orbit) satellites like Starlink orbit much closer at 300-900 miles, delivering latency of 20-50ms (comparable to cable internet) and faster speeds of 50-200 Mbps. LEO satellite has transformed rural internet access into a viable option for most online activities.

Is 100 Mbps fast enough?

Yes, for most households. 100 Mbps is enough for one or two people streaming HD video, browsing, and handling video calls simultaneously. The FCC defines 100 Mbps as the minimum threshold for broadband internet because it’s enough for the basics, and light to moderate use.

Where it is in households with multiple users. If several people are streaming 4K, gaming online, and video conferencing at the same time, 100 Mbps may not be enough. A household such as this will be better off with at least 200 Mbps.

The other variable is upload speed. The FCC minimum recommended upload speed is 20 Mbps. Many types of internet connections, particularly cable and DSL, deliver much lower upload speeds, sometimes as low as 10–20 Mbps. If you work from home, host video calls, or back up large files to the cloud regularly, upload speed is often more critical than download speed.

Why does my speed test show faster than my actual experience?

Several factors can create a gap between that number and what you actually experience day to day. The most common culprit is Wi-Fi. Speed tests run on a device connected via Ethernet will almost always outperform those over wireless, where distance, walls, and interference all reduce performance. If your speed test result looks great but your connection feels slow, try testing from the same location and device you normally use.

Network congestion is the other major factor. Your internet provider shares bandwidth across many customers in your area, and during peak hours (typically evenings and weekends) that shared capacity gets stretched. A speed test at 10 AM on a Tuesday may be much faster than your actual evening experience.

Other contributors include background apps consuming bandwidth during normal use, the performance of the specific website or service you’re trying to reach, and the age and processing power of your devices themselves.

When you run an internet speed test, you’re probably focused on your download speed. But if you’ve ever experienced buffering videos, choppy Zoom calls, or a game character that teleports across the screen, you know that raw speed isn’t the only thing that matters.  

Enter latency: the invisible metric that often dictates how fast your internet actually feels. Latency measures the time it takes for data to travel from your device to a server and back.  

In this guide, we’ll break down what latency is, how to interpret your ping vs latency results, and practical steps to fix internet lag for good.

Key Takeaways: Internet Latency

  • Latency ≠ speed: Latency is a measure of delay (ms).
  • The Millisecond Metric: Latency is measured in milliseconds (ms); lower numbers are always better. 
  • Real-Time Impact: Low latency is critical for gaming, video calls, and real-time applications. 
  • Diagnosis: Running a speed test helps determine whether latency issues are inside your home or with your ISP. 
  • Optimization First: Many latency problems can be fixed by optimizing your setup before upgrading your plan. 

What Is Latency?

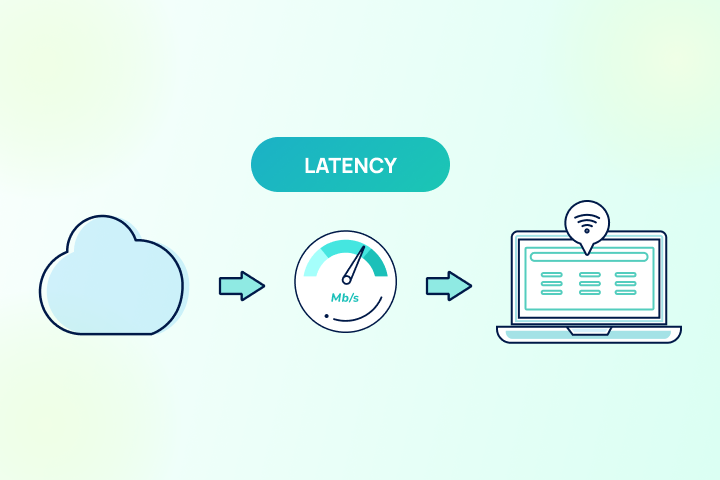
Latency is the time it takes for a data packet to travel from your device to a server and back again. 

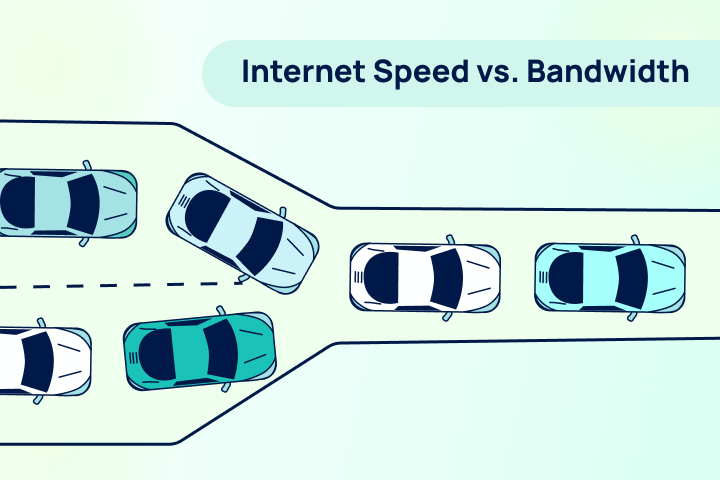
Think of your internet connection like a highway. Bandwidth is the number of lanes on the road, determining how many cars can travel at once. Latency is the time it takes a single car to drive from Point A to Point B. 

Common Latency Terms Explained

  • Latency: The broad term for the delay in data transfer. Latency is often referred to as lag or delay.
  • Ping: The utility program used to measure latency. When you “ping” a server, you are testing the latency.
  • Ping Rate: The resulting number from that test, measured in milliseconds (ms).
  • Lag: The noticeable delay you experience on your screen is caused by high latency.
  • Jitter: The variation in your ping rate over time. If your ping jumps from 20ms to 200ms and back, you have high jitter, which causes stuttering performance.
  • Packet Loss: Data packets that fail to reach the destination, causing delays and glitches. 

Why Latency Matters More Than You Think

There is a common misconception that “fast internet” simply equals high download speeds. While download speed determines how quickly you can pull a large file from the web, latency determines how responsive that connection is. If you have high latency, your internet will feel sluggish even with a gigabit connection. You might click a link and wait three seconds for the page to load, or ask a question on a video call only to have your colleague answer you five seconds later. Understanding latency is the key to diagnosing these real-world performance issues.

What Is Good Latency?

Good latency depends on what you’re doing online, but the lower the number, the better and more responsive your internet connection will be. Some online activities, like gaming and video conferencing, perform better with very good (low) latency. Whereas streaming video does not benefit from low latency. 

General Latency Benchmarks

  • Poor (100+ ms): Noticeable delays. You will likely experience internet lag, audio syncing issues (“talk-over”), and slow-loading web pages.
  • Fair (50 to 99 ms): Acceptable for most browsing and streaming on Netflix. However, you might notice slight delays in fast-paced games or occasional hiccups in video calls.
  • Good (20 to 49 ms): Perfectly responsive for almost all activities. You can game, stream, and video chat without noticeable delay.
  • Very Good (up to 19 ms): Instant response. This is the gold standard, essential for competitive gaming, professional trading, and seamless real-time interactions.

How to Test Your Internet Connection Latency

The best way to understand your current performance is to run a speed test. When you do, you will see three main numbers: 

  1. Download Speed: How fast data comes to you, measured in Mbps. 
  1. Upload Speed: How fast you send data out, measured in Mbps.
  1. Ping (Latency): The reaction time of your connection, measured in milliseconds (ms).

To get the most accurate picture, try testing your connection in different scenarios:  

  • Wi-Fi vs. Wired: Plug directly into your router to see if your WiFi signal is the bottleneck.
  • Peak vs. Off-Peak: Test at 8:00 PM (peak) and 8:00 AM (off-peak) to check for network congestion. 
Ping spikes don’t lie.

Your connection has a latency problem. Or it doesn’t. Find out.

Reading about latency is one thing. Seeing your actual ping in real time is the part that actually matters.

Test my latency right now

What Latency Reveals That Download Speed Doesn’t

High download speeds are great for streaming movies, but a high ping rate will ruin an online gaming session. If you see a low ping (under 20ms) but slow downloads, the issue might be bandwidth congestion. If you see high speeds but high ping (over 100ms), you are dealing with internet latency issues. 

To get the most accurate picture, try testing your connection in different scenarios: 

  • WiFi vs. Wired: Plug directly into your router to see if your WiFi signal is the bottleneck.
  • Peak vs. Off-Peak: Test at 8:00 PM (peak) and 8:00 AM (off-peak) to check for network congestion.

Who Needs Low Latency the Most?

While everyone benefits from a snappy connection, certain activities require lower latency more than others. 

Video calls (Zoom, Meet, Teams)

  • Symptoms: People talk over each other, awkward delays before someone hears you, lips out of sync, and distorted audio.
  • Why: Conversational turn-taking falls apart above 100 ms; jitter forces the app to buffer more, adding even more delay. Tiny bursts of packet loss cause the “robot voice.”
  • Quick win: Prefer Ethernet, block uploads from other devices during calls, and enable QoS/Device Priority for conferencing.

Online gaming

  • Symptoms: Missed shots, delayed inputs, rubber-banding, getting “peeked” before you see the opponent.
  • Why: Game engines expect consistent, low delay. Above ~50–60 ms, timing windows get tight; spikes (jitter) are worse than a steady 40 ms. Loss triggers rollbacks or desync.
  • Quick win: Wire the console or your PC, choose the nearest server and region, and turn on SQM or FQ-CoDel to prevent uploads and streams from blowing up your ping mid-match.

Cloud apps & SaaS

  • Symptoms: Menus feel sluggish, file trees take a beat to open, micro-delays add up to “why does this feel slow?”
  • Why: Each UI action chains multiple small requests. 40–60 ms per request adds up to seconds across a flow.
  • Quick win: Keep latency low and stable; if you’re on Wi-Fi, improve signal quality or use Ethernet for your primary workstation.

Streaming & live TV

  • Symptoms: Long start times when you hit Play, choppy live streams, and fluctuating video quality.
  • Why: Players buffer to mask jitter; when jitter and loss spike, they downshift quality or stutter.
  • Quick win: Reduce contention (pause large downloads), strengthen Wi-Fi, or watch via a wired streaming box.

Smart home & voice assistants

  • Symptoms: Noticeable pause between “Hey…” and response, delayed smart-light actions.
  • Why: Small requests are latency-sensitive; extra milliseconds break the illusion of immediacy.
  • Quick win: Improve Wi-Fi placement in IoT zones; avoid overcrowding 2.4 GHz if your devices support 5/6 GHz.

Remote Work

  • Symptoms: Typing lag, cursor jumps, and delayed screen draws.
  • Why: These tools stream interactions in real time; latency and jitter directly show up as lag.
  • Quick win: Use an Ethernet cable; prioritize the device; minimize background uploads (cloud sync, backups, drive uploads).

Bottom line: Throughput governs how much you can download; latency, jitter, and packet loss govern how responsive everything feels.

Comparing Latency by Internet Connection Type

The type of internet connection you have will determine how fast or slow your internet connection is.

Internet TypeTypical Latency (ms)Context
Fiber5–20Consistently lowest; great for gaming, calls, and cloud apps.
Cable15–40Can spike during congestion.
DSL20–40Older copper; stable but slower speeds and higher spikes than fiber.
Fixed Wireless Internet15–40RF interference and line-of-sight impact variance; good when the signal is strong.
5G Home Internet 20–50Performance varies by signal quality and network load; improving with L4S.
Satellite — LEO (Starlink)25–60Much lower than GEO; weather/obstructions and routing still matter.
Satellite — GEO (HughesNet & Viasat)500–650Long distance to orbit dominates round-trip delay; fine for browsing/streaming, not for twitch gaming or real-time calls.

What Causes High Latency (Lag)?

If your speed test results show high latency, the culprit usually falls into one of four categories:

1. Physical Distance & Routing

Every request has to travel to a server and back; the farther away that server is, and the more “hops” your traffic takes along the way, the higher your round-trip time. If you’re in New York connecting to a server in Tokyo, physics dictates a higher ping than connecting to a server in Chicago. Content Delivery Networks (CDNs) and regionally hosted services help by moving content closer to you, reducing the number of hops.

2. Network Congestion

Sometimes the issue isn’t in your house at all. Congestion occurs when too many people try to use the internet infrastructure at once. This is especially common with cable internet during “prime time” (7 p.m. – 10 p.m.), when everyone in your neighborhood gets home and starts streaming or gaming. Your internet connection type also plays a role here. Fiber is typically the least susceptible to congestion spikes, while cable and 5G home internet are more prone to them under heavy load. Satellites behave differently due to physics: LEO (low-Earth orbit) systems like Starlink orbit much closer to Earth, keeping round-trip times low (~20 ms), while GEO (geostationary equatorial orbit) satellites sit about 22,000 miles up, resulting in the highest latency of any connection type.

3. Home Network Causes 

This is the most common source of internet lag. 

  • Bufferbloat: Oversized queues in your router or modem, intended to manage traffic, end up adding significant delay whenever someone uploads a file, runs a cloud backup, or joins a video call. It can spike your ping heavily even when your baseline latency looks fine.
  • Wi-Fi Interference: Walls, microwaves, and even your neighbor’s WiFi can degrade your signal.
  • Router Placement: Putting your router in a cabinet or the basement limits its reach.
  • Overloaded Bandwidth: If someone is downloading a 100GB game file while you try to make a video call, your packets will get stuck in a queue.

4. Device-Level Causes 

An older computer struggling to run modern software can cause network lag. Too many open browser tabs or background applications (like Steam updates or cloud backups) can also hog your resources.

For a deeper dive into troubleshooting, read our article on 15 reasons for slow internet.

How to Reduce Internet Latency (Optimize First)

Before you call your ISP to upgrade your plan, try these quick fixes to lower your ping rate. 

Quick Fix Checklist 

  1. Use an Ethernet Cable: Wi-Fi is convenient, but a wired connection offers the most stable connection to your router and eliminates signal interference.
  2. Close Background Apps: Shut down bandwidth-heavy apps like Dropbox, OneDrive, or game launchers running in the background.
  3. Restart Your Gear: Restarting your modem and router clears the cache and can resolve temporary glitches.
  4. Limit Devices: If your internet traffic affects speed, try disconnecting smart home devices or phones that aren’t in use.

1. Optimize Your Wi-Fi Environment

If you cannot use Ethernet, follow these steps to make your wireless signal as efficient as possible:

  • Router Placement: Place your router in a central, high location. Avoid cabinets or basements that block signals.
  • Band Management: Separate your 2.4 GHz, 5 GHz, and 6 GHz networks so your high-performance devices select the best band. If your hardware supports it, enable Multi-Link Operation (MLO) on Wi-Fi 7 gear to smooth out spikes and dodge interference.
  • Update Firmware: Ensure your router is running the manufacturer’s latest software to benefit from the latest security and performance patches.

2. Advanced Router Tuning

To truly “lag-proof” your home, dive into your router’s settings (check your manual or the manufacturer’s website for specific instructions):

  • Enable Quality of Service (QoS): Use “Device Priority” settings to prioritize gaming, voice, and video traffic over lower-priority traffic, such as file downloads.
  • Fix Bufferbloat: Turn on Smart Queue Management (SQM) or FQ-CoDel. These modern algorithms stabilize latency even when someone else on your network is uploading a large file or streaming 4K video.

3. App and Network Level Adjustments

If home optimization isn’t enough, look at how your apps and provider handle data:

  • App Tuning: Real-time apps (games, Zoom, remote desktops) favor protocols such as UDP/WebRTC to minimize latency. Ensure your firewalls aren’t over-inspecting this traffic, as excessive security scanning can add jitter.
  • Check for L4S Support: On cable or 5G home internet, ask your provider if they support L4S (Low Latency, Low Loss, Scalable Throughput), which dramatically reduces “working” latency during congestion.
  • Consider a Connection Upgrade: If problems persist, consider your access type. Fiber delivers the lowest latency consistently. For rural satellite users, switching from older GEO systems to LEO services(like Starlink) can reduce latency from 600ms to under 60ms.

When Optimization Isn’t Enough

If you have optimized your home network and are still seeing poor latency results across multiple devices, the issue likely lies with your ISP. This is often due to aging infrastructure, network congestion, or ISP throttling. 

When It Might Be Time to Upgrade

Have you optimized your devices and network, but are still experiencing high lag? It may be time to consider upgrading your internet service or switching to a different connection type. 

  • Switch to Fiber: If available, fiber internet is the best way to lower latency. 
  • Cable Upgrades: If you are on an older cable plan, a newer modem-router combo from your ISP might handle congestion better. 
  • Ditch Satellite: If you rely on real-time applications, standard satellite internet will always be a struggle. Look for fixed wireless or 5G home internet options in rural areas. 

You can compare the best internet providers in your area to see if a lower-latency option is available.

Emerging Low Latency Technology to Watch

Two upgrades are reshaping how the internet handles latency. First, L4S (Low Latency, Low Loss, Scalable Throughput) is rolling out across major cable and mobile networks. Instead of letting queues swell during congestion and spiking your ping, L4S uses modern congestion signaling to keep interactive traffic (games, calls, cloud apps) responsive even when the line is busy. It’s also gaining app-side support from big ecosystem players (think game engines, GPU makers, and real-time comms platforms), which means you’ll see benefits without tweaking settings once your network and apps speak the same language.

Second, Wi-Fi 7 (with Wi-Fi 8/UHR on the horizon) addresses latency in the home. Features like Multi-Link Operation (MLO) let devices use multiple bands/links simultaneously and switch paths quickly when interference occurs, trimming worst-case spikes (the hiccups you notice) while improving reliability for voice, video, and gaming. In practical terms: pair an L4S-enabled access network with a modern Wi-Fi 7 router and clients, and you get lower “working latency” under load from the curb to your couch.

What Latency Is Telling You

Latency affects how responsive your internet feels, often more than download speed does. By checking your ping regularly with a speed test, you can spot performance issues before they ruin your movie night or work presentation. 

Remember, most latency issues can be improved without switching providers; it just takes a little troubleshooting.

Lag is measurable. Start there.

Know your ping before it costs you.

TestMySpeed measures your latency alongside download and upload speeds, giving you the full picture of what your connection is actually capable of.

Run a free speed test

Frequently Asked Questions About Internet Latency

What is a good latency for gaming?

For online gaming, aim for less than 50 ms; competitive shooters and fast esports feel best at <20 ms.

Why is my latency high but my speed is fast?

This usually means you have plenty of bandwidth (capacity) but are experiencing congestion or signal interference. It’s like a wide highway (high speed) that is stuck in bumper-to-bumper traffic (high latency).

Does Wi-Fi increase latency?

Yes. Wireless signals are subject to interference and signal loss. Using a wired Ethernet connection almost always results in lower ping.

Is latency worse at night?

Often, yes. This is called “peak hours,” when everyone in your neighborhood gets home and starts streaming or gaming, causing congestion on the ISP’s local node.

How can I lower my ping without upgrading my plan?

Start by using a wired connection, placing your router in a central location, and using your router’s QoS settings to prioritize your device.

What is the difference between latency, ping, and lag?

Latency: The actual delay measured in milliseconds (ms) for a request to go to a server and back.

Ping: The test/tool that measures latency.

Lag: The symptom you feel (stutter, delay, rubber-banding) often caused by high latency, jitter, or packet loss.

What is internet latency?

Internet latency is the round-trip delay—measured in milliseconds (ms)—for data to travel from your device to a server and back. Lower latency makes apps feel more responsive, independent of download and upload speeds.

What counts as high latency?

As a rule of thumb to gauge latency :

  • <20 ms = excellent
  • 20–50 ms = good
  • 50–100 ms = acceptable but noticeable
  • >100 ms = high latency (you’ll feel lag in games, calls, and interactive apps).

What is a good latency for everyday use?

For browsing, streaming video, and most cloud apps, 20–50 ms is a good target. It keeps pages snappy and streams stable even during light household activity.

What is a good latency for gaming and video calls?

For online gaming, aim for <50 ms; competitive shooters and fast esports feel best at <20 ms.

For video conferencing and working remotely, staying <60 ms with low jitter avoids talk-over and lip-sync issues.

Why do I have latency issues even with fast internet?

Speed (throughput) measures how much data moves per second; latency measures how quickly each request gets a response. Distance to servers, Wi-Fi interference, router bufferbloat, and network congestion can all raise latency despite high Mbps.

How can I reduce latency at home?

  • Use Ethernet for PCs, consoles, and TVs.
  • Improve Wi-Fi placement; pick cleaner channels; update firmware.
  • Turn on QoS/Device Priority for calls and games.
  • Enable SQM/FQ-CoDel on your router to control bufferbloat.
  • If available, choose fiber or providers advertising L4S/low-latency features.

Check your router or gateway’s manual or the manufacturer‘s website for device-based actions.

Does the type of internet connection affect latency?

Yes, each type of internet has different inherent latency. Here are the typical latencies for each:

Yes, the weather can affect internet speed, but it depends on your internet connection type. Wireless connections (satellite, fixed wireless, and 5G home internet) are the most vulnerable because precipitation and obstruction directly attenuate radio signals. Wired connections (fiber, cable, and DSL internet) are rarely affected by weather itself; outages almost always trace back to power loss or physical damage to cables and equipment. 

Weather doesn’t hit every internet connection the same way. If you have fiber, cable, or DSL, a rainstorm is unlikely to touch your signal, but it can knock out the power or damage the equipment that keeps you online. If you’re on satellite, fixed wireless, or 5G home internet, the weather is a direct threat: rain, snow, ice, and even wet leaves absorb and scatter the radio waves your connection depends on. 

Below, we explain how each connection type behaves in bad weather and what to do. 

Key Takeaways: Weather and Internet Performance

  • Yes, weather can affect internet performance, but mostly on wireless internet connections (satellite, fixed wireless, some 5G).
  • Not usually your Wi-Fi itself: power blips or congestion cause many “storm” slowdowns.
  • Satellite: rain fade and snow or ice on the dish cause dropouts.
  • Fixed wireless & 5G: wet foliage, rain, and wind, and mmWave sensitivity; improve line of sight.
  • Fiber, Cable, and DSL: weather rarely affects the signal; issues typically result from power or plant damage.

Comparing Weather Impacts on Different Internet Connection Types

Connection type Resilience Main weather risk Primary fix 
Fiber Highest Power outage to ONT or physical cable damage, not the signal itself UPS on ONT and router; check ONT lights after storms 
Cable (coax) High Water ingress at connectors; ice or wind on aerial runs; post-storm congestion Tighten connectors; drip loops outdoors; UPS 
DSL (copper) Moderate Wet soil raises line noise; attenuation causes sync drops or disconnects Replace filters; request ISP line check; upgrade to fiber or cable if available 
5G home Moderate Heavy rain and wet foliage add mild attenuation; Low-E windows worsen dips Rain, humidity, wet foliage attenuate the signal; ice or wind can shift antenna alignment
Fixed wireless Moderate–low Rain fade on Ka/Ku-band; snow or ice blocking the dish; storms near ground stationsClear antenna of snow or ice; improve line of sight; request higher-gain equipment 
5G home — mmWave Low Rain fade at 24–71 GHz; any obstruction (wet leaves, glass) causes significant drops External antenna; tower-facing window; backup connection 
Satellite (Starlink, HughesNet, Viasat) Lowest Rain fade on Ka/Ku-band; snow or ice blocking dish; storms near ground stations Keep dish clear; dish heater if available; mobile hotspot backup 
All connection types are vulnerable to power outages during severe storms, regardless of resilience tier.

Before You Blame the Weather

Weather can disrupt internet service, but sometimes, weather isn’t the cause. Most slowdowns are:

IssueSymptomsCheckFix
Power blips/outagesLEDs look wrong; Wi-Fi says “no internet.”ISP outage map; ONT/modem/router lightsReboot the ONT or modem, then the router; use a UPS
Network congestionSlow even on Ethernet at busy times; high latencyTest off-peak vs. peakSchedule big tasks off-peak; enable QoS; consider a faster plan or backup connection
Home network issues (mostly wireless)Are the error lights on the router or the gateway? Router in a cabinet or obstructed?Error lights on the router or the gateway? Router in a cabinet or obstructed?Unplug the modem, then the router, for a few minutes; move closer to the router; place it in a central location away from walls and furniture

Does Weather Affect Fiber Internet?

Rarely. Fiber internet carries light through glass, so the weather doesn’t interfere with the signal itself. Issues usually come from power outages or physical damage to cables or network equipment.

What actually happens

  • Rain, snow, cold, and heat: Minimal effect on the optical signal; problems arise if the optical network terminal (ONT) or distribution gear loses power or gets damaged.
  • Flooding, construction, or ice on aerial runs: Physical damage or equipment failure, not slowdowns.
  • In-home Wi-Fi: Weather doesn’t affect your fiber speed, but it can reveal weak Wi-Fi placement or interference.

Quick diagnostics

  • Check your provider’s outage map or app.
  • Plug a laptop into the router (or ONT, if supported) via Ethernet and compare it to Wi-Fi.
  • Verify ONT lights (Power, Alarm) and router WAN status.

What you can do right now

  • Reboot the ONT and router if service is unstable after a storm.
  • Test with an Ethernet connection to rule out Wi-Fi.
  • If the ONT indicates errors or there’s no light on the fiber jack, contact your internet provider.

Be prepared

  • Put the ONT and router on a UPS to get through brief power outages.
  • Use surge protection and avoid crimped or tight bends in fiber drops.
  • Check the fiber entry point and ONT for damage, loose cables, or disconnects.

Weather and Fiber Internet At-a-Glance

Weather factorTypical impactWhat helps
Rain, snow, cold, heatVery low (signal unaffected)UPS; reboot after storms
Power outageLoss of serviceUPS; check neighborhood power
Physical damage (flood, backhoe, ice)Outage until repairedISP ticket; protect entry path
Rain, wind, or just a garbage ISP?

Don’t blame the weather until you’ve checked the data.

Run a speed test right now and find out if today’s slowdown is the storm outside or the provider you’re paying every month.

Test my speed right now

Does Weather Affect Cable Internet?

It can. Cable internet coaxial plants are resistant to weather events; however, water ingress, wind, ice on aerial lines, and power issues can still cause outages or temporary slowdowns.

What actually happens

  • Water ingress at connectors and splitters: Raises noise and attenuation, causing speed dips or timeouts.
  • Ice and wind on aerial spans: Physical strain can cause brief errors or outages.
  • Storm-driven congestion: After outages, many modems sync simultaneously, causing temporary slowdowns.
  • In-home coax and Wi-Fi issues: old splitters, long coax runs, or weak Wi-Fi signal diminish performance.

Quick diagnostics

  • Check the modem status page for downstream SNR/power and event log errors.
  • Bypass extra splitters and connect the modem to the first coax point.

What you can do right now

  • Reboot the modem and router to reset them and clear their caches.
  • Inspect and tighten coax connectors; remove cheap splitters.
  • Try a different coax outlet or a different cable.

Be prepared

  • Use weather-rated coax and quality splitters.
  • Create drip loops on outdoor runs to prevent water intrusion.
  • Plug the modem and router into a UPS, and keep your provider support information handy.

Weather and Cable Internet At-a-Glance

Weather factorTypical impactWhat helps
Heavy rain, ice, windNoise, brief errors, occasional outagesCheck connectors and splitters; reboot
Water ingressPersistent speed or latency issuesReplace fittings and splitters; tech visit
Post-storm congestionTemporary slow speedsSchedule high-demand tasks for off-peak hours

Does Weather Affect DSL Internet?

It can. DSL internet uses older copper pairs that are more vulnerable to moisture, corrosion, and electrical noise, and the weather can exacerbate these issues.

What actually happens

  • Rain and wet ground: Moisture raises line attenuation/noise then sync rate drops or disconnects.
  • Wind or ice damage to aerial loops: Physical stress can introduce intermittent faults.
  • Aging inside wiring and filters: If the voice line sounds noisy, DSL will also struggle.

Quick diagnostics

  • Listen for audible noise on the phone line with a corded phone.
  • Test the modem at the test jack (if accessible) to isolate faulty wiring inside or outside the home.
  • Check the modem’s status lights.

Note: Not all installs include an accessible test jack, particularly newer fiber-to-the-node (FTTN) and VDSL2 setups. If yours doesn’t have one, skip this step and contact your ISP to request a remote or on-site line check instead

What you can do right now

  • Reboot the modem.
  • Replace microfilters and suspect wiring.
  • Use a short, high-quality phone cable from the wall to the modem.

Be prepared

  • Upgrade to fiber or cable internet where available.
  • Keep the modem and router on a UPS; use surge protection on the phone pair.
  • Ask your provider for a line check if rain reliably causes drops.

Weather and DSL Internet At-a-Glance

Weather factorTypical impactWhat helps
Rain or wet soilHigher attenuation or noise causes slowdownsTest at the provider network entry point, replace filters, and ask the provider for a line check
Wind and iceIntermittent faultsTechnician visit to repair or secure aerial runs
Aging inside wiringChronic instabilityRewire and shorten run; upgrade equipment

Does Weather Affect Satellite Internet?

Yes. Satellite internet uses high-frequency radio waves that are sensitive to precipitation and blockage, a phenomenon often called rain fade.

What actually happens

  • Heavy rain or snow: Precipitation absorbs and scatters the signal, causing slowdowns or brief dropouts.
  • Snow or ice on the dish: A physical blockage detunes or breaks the link until it clears or melts.
  • Storms near ground stations: Even if skies are clear at your house, weather along the network path can affect service.
  • Obstructions and low elevation angles: Trees and buildings, plus wet foliage, worsen marginal links.

Quick diagnostics

  • Check the app and your router for outage or obstruction messages and signal quality.
  • Compare performance under clear and stormy conditions to confirm the weather’s impact.
  • Inspect the dish view (sky clearance) for snow, ice, or debris buildup.

What you can do right now

  • Wait out intense cells—short dropouts are common in downpours.
  • Clear snow and ice from the dish (safely); ensure an unobstructed sky view.
  • Reboot the modem and router after severe weather to refresh operation.

Be prepared

  • Mount with a clear line-of-sight; consider a higher mast if trees or buildings intrude.
  • Use dish heaters or covers where supported; route cables with drip loops.
  • Put gear on a UPS; keep a backup connection (LTE/5G hotspot) for critical uptime.

Weather and Satellite Internet At-a-Glance

Weather factorTypical impactWhat helps
Heavy rain (rain fade)Slowdowns and dropoutsWait out cells; keep a clear line of sight
Snow or ice on the dishTemporary lossClear buildup; dish heater or shield
Storm near the ground stationRegional degradationRedundancy (hotspot); patience
Obstructions and wet foliageOngoing attenuationRelocate or mount on a mast; trim where allowed

Does Weather Affect Fixed Wireless Internet?

Sometimes. Fixed wireless internet delivers service from a nearby tower to a receiver at your home. Performance depends on signal frequency, line of sight, and distance, all of which can be influenced by weather.

What actually happens

  • Rain & heavy humidity: Water absorbs and attenuates radio waves, especially at higher frequencies, reducing signal strength for short periods.
  • Snow and ice: Accumulation on outdoor antennas or brackets can block or slightly detune the signal; wet, heavy snow is the worst culprit.
  • Wind: Can flex masts or slightly shift alignment, raising error rates until the gusts calm.
  • Foliage growth after rain: Leaves hold water and become more dense, adding seasonal or post-storm attenuation.
  • Temperature swings: Can affect cable loss and radio components at the margins, especially on long runs or with older gear.
  • Power outages: The link may be fine, but your equipment (or the tower or network stations) loses power.
  • Licensed* links are generally more stable; unlicensed (e.g., 5 GHz) links can be more susceptible to interference, which wet foliage worsens.

*Licensed fixed wireless or 5G uses radio frequencies that the provider has exclusive rights to, and are more reliable and consistent. Unlicensed uses open or shared bands (Wi-Fi frequencies), which are cheaper and easier to deploy but more prone to interference and speed swings.

Quick diagnostics

  • Run a speed test over Ethernet vs. Wi-Fi to isolate local wireless issues.
  • Check signal quality (in the provider app or router UI); note if it drops during storms.
  • Inspect the antenna line of sight for new obstructions (leaves, ice, snow).
  • If speeds tank only on Wi-Fi, move the router or switch bands (2.4 GHz for range; 5 GHz for throughput).

What you can do right now

  • Reboot the receiver and router after severe weather.
  • Clear snow and ice from outdoor equipment (if safely accessible).
  • Reduce obstacles: position indoor receivers near a window facing the tower; avoid metal screens or low-E coatings if possible.
  • Try another band or channel in the admin app, if available.
  • Use Ethernet for critical devices during storms.

Be prepared

  • Mount outdoor gear securely; tighten brackets and use weather-rated coax/connectors.
  • Add a surge protector and a UPS for the modem and router.
  • Ask your provider about an external antenna upgrade or higher-gain equipment if you’re far from the tower.
  • Keep a backup option (mobile hotspot or satellite failover) for outages.

Weather and Fixed Wireless Internet At-a-Glance

Weather factorTypical impactWhat helps
Heavy rain or humidityMild to moderate attenuationReboot, relocate CPE, higher-gain antenna
Wet snow or ice on the gearTemporary dropoutsClear buildup; heated or rain-shielded mounts
High windBrief noise or alignment driftRigid mounting; check brackets
Leafy, wet foliageOngoing attenuationRaise or relocate antenna; trim where permitted
Power outageFull lossUPS; backup connection

Does Weather Affect 5G Home Internet?

It can—how much depends on which 5G band your service uses. Mid-band (sub-6 GHz) 5G home internet is generally resilient; mmWave (high-band) 5G delivers top speeds but is more sensitive to rain, obstruction, and even window coatings.

What actually happens

  • Mid-band (roughly 2.5–4 GHz): Usually stable through typical rain and snow; tower congestion and power issues are more prevalent than weather itself.
  • High-band or mmWave (24–71 GHz, but commonly 24–39 GHz in deployed U.S. networks): Offers multi-gig speeds at short ranges, but rain fade, and any obstruction (wet leaves, glass, even a hand over the gateway) can cause significant drops.
  • Inside the home: Low-E or metal-framed windows and foil-backed insulation can attenuate 5G signals, exaggerating weather-related dips.

Quick diagnostics

  • Check the gateway app for your current band (mid-band vs. mmWave) and signal metrics.
  • Move the gateway to different windows and walls; test again during and after inclement weather to see if band selection or signal path changes.

What you can do right now

  • Reposition the gateway to a window facing the tower; avoid metal screens and low-E coatings if possible.
  • Elevate the unit and keep it clear of large appliances or mirrors.
  • Force a band refresh by rebooting (some apps also let you “optimize” placement).
  • Connect critical devices via Ethernet to remove local Wi-Fi variables.

Be prepared

  • Ask the provider about external antenna options or a different gateway model with better radios.
  • Use a UPS for your gateway during power outages.
  • Maintain a secondary connection (mobile hotspot, cable, DSL, or satellite) to ensure critical uptime.

Weather and 5G Home Internet At-a-Glance

Weather factorTypical Impact (Mid-band (sub-6) / mmWave (high-band)What helps
Moderate rain/snowLow / Moderate-HighReposition gateway; clear obstructions
Heavy rain (downpours)Low – Moderate / High (rain fade)Closer and a clear line of sight; external antenna
Wet foliage and obstructionsLow – Moderate / HighElevate gateway; different window
Power outagesHigh / HighUPS; backup connection

If Bad Weather Isn’t the Problem, What Is?

If the weather is clear, then the reasons for slow internet are likely within your home and under your control. Here are a few easy troubleshooting actions you can take to improve your internet connection.

Restart Your Router

Routers perform best when caches and tasks are purged. You can do this simply by restarting your router and/or modem. We recommend doing this at least once a month. Tasks and connections can bog down hardware, so this simple step can solve many issues.

Move Closer to Your Router

The strength of your Wi-Fi connection depends on how close you are to the router and what is between you and it. Wi-Fi signals slowly weaken with distance, and barriers like furniture and walls can interfere with or deflect them. You can fix this by moving closer to your router, investing in Wi-Fi extenders, and placing the router away from obstructions.

Upgrade Your Internet Plan

Sometimes the issue may be the internet connection. Cable internet, for instance, is more susceptible to network congestion. You can upgrade to a faster plan to offset this, or switch to a different internet service. Different internet activities require different bandwidths. And no matter what you do, there’s a limit depending on what you pay for. Upgrade your speed for your internet lifestyle and prevent headaches down the road.

How Can I Prepare My Internet for Inclement Weather?

If you’re in an area with frequent weather disruptions or connectivity is critical for your remote work, prepare now for outages. Here are quick, easy actions you can take to stay online or bounce back when storms hit.

Power: Put your ONT, modem, router, or gateway on a UPS; storms often cause brief power dips.

Surge protection: Use surge protection on power and (where applicable) repair cabling and wiring.

Cabling: Place drip loops on outdoor cables and replace corroded connectors and splitters.

Line of sight: Keep dishes, antennas, and receivers clear of snow, ice, and debris; maintain a clear line of sight.

Backup plan: Keep a mobile hotspot or neighbor’s guest Wi-Fi as a fallback for critical work.

Safety: Never access roofs during storms; when in doubt, schedule a tech visit.

Pro tip: Schedule a monthly reboot of your modem, router, or gateway, and a quarterly check of your cables and connections to optimize your home network.

Weather the Storm with Better Internet

Bad weather is one of those phenomena we cannot control. What we can control, though, is how we prepare for rainy days. If you’re looking for reliable internet that keeps you connected at all times, consider your connection type and the available providers in your area. Enter your ZIP code into our provider search tool to find the best providers and plans near you.

One slowdown is weather. A pattern is a provider problem.

See every ISP available in your area.

If your speeds drop every time conditions change, your provider may be using weather as cover. See what ISPs are competing in your area and what they’re actually delivering.

Compare providers

FAQs: Weather, Wi-Fi, and Internet Performance

Does the weather affect internet performance?

Yes, mainly for wireless options (satellite, fixed wireless, and some 5G). Fiber, cable, and DSL are usually impacted indirectly by power loss or physical damage, not the weather signal itself.

Can the weather affect the internet connection even if my power stays on?

Yes. Towers, nodes, or ground stations can lose power or suffer damage even if your home doesn’t. Rain, snow, and wet foliage can weaken wireless links.

Does bad weather affect Wi-Fi?

Indirectly. Outdoor weather doesn’t travel through your living room, but storm-related interference, power blips, and congestion can cause problems that feel like Wi-Fi issues. Always test Ethernet vs. Wi-Fi to isolate.

Does the weather affect Wi-Fi signal strength inside my house?

Not directly. What you’re sensing as “signal strength” is usually interference, poor router placement, or congestion—not the rain itself.

Can rain affect Wi-Fi or home internet speeds?

Rain can attenuate wireless backhaul (satellite, fixed wireless, mmWave 5G) and cause brief dropouts. For fiber, cable, and DSL, rain more often causes water ingress or power issues, not true Wi-Fi signal loss.

Why is satellite slower in storms (what is rain fade)?

Satellite uses high-frequency radio that precipitation absorbs and scatters (“rain fade”), so heavy rain/snow can reduce SNR and cause short outages, especially with snow on the dish.

Does snow or ice on my dish or antenna matter?

Yes. Snow and ice physically block or damage dishes and antennas. Clear it safely from the ground when bad weather passes; consider heaters or shields if available.

Will wind affect fixed wireless or 5G home internet?

It can. Wind flex can nudge outdoor antennas off alignment, and wet, leafy trees add attenuation. For 5G, mmWave is more sensitive to rain and obstructions than mid-band (sub-6 GHz).

Fiber is “weather-proof,” so why does mine drop in storms?

The glass signal is fine; the usual culprits are power outages (to your ONT or neighborhood gear) or physical damage from flooding/ice/backhoes. Check ONT lights and your ISP’s outage map.

Why does cable or DSL internet slow down after a storm, even when it’s sunny now?

Two reasons: post-outage congestion (many reconnections at once) and water ingress in coax and copper (cable and DSL), which raises noise and attenuation until fittings dry or are replaced.

How do I tell whether it’s weather, congestion, or Wi-Fi?

  • Weather: performance tracks the storm; wireless links drop briefly.
  • Congestion: slow, even on Ethernet, during peak times; higher latency and jitter.
  • Wi-Fi: Ethernet is fine; Wi-Fi isn’t. Moving closer to the router helps.

Quick fixes during storms (what actually helps)?

Use Ethernet for critical devices, reboot the modem, router, and/or gateway after outages, and ensure a clear line of sight for dishes and antennas.

Can window coatings or building materials affect 5G home internet?

Yes. Low-E glass, metal screens, and foil-backed insulation can attenuate indoor 5G home internet gateways, worsening any weather-related dips. Try a tower-facing window or ask about an external antenna.

Does Starlink slow down in rain?

Yes, Starlink can slow down in heavy rain or snow. Starlink uses Ka- and Ku-band satellite signals, which are susceptible to rain fade, which is a phenomenon where precipitation absorbs and scatters high-frequency radio waves, reducing signal strength. Brief speed dips or dropouts during heavy downpours are normal. Snow or ice accumulating on the dish is a more common culprit than rain alone, as a physical blockage can cut the connection entirely. Light to moderate rain typically causes minimal impact. To minimize disruptions, keep the dish free of snow and ice (as long as it is safe to do so), ensure a clear, unobstructed sky view, and consider a mobile hotspot as a backup for critical connectivity during storms.

Does T-Mobile home internet work in storms?

Usually, yes. T-Mobile Home Internet runs on mid-band 5G (primarily n41 at 2.5 GHz and C-Band around 3.7–3.98 GHz), which is relatively resilient to rain and moderate weather. The signal itself is unlikely to degrade significantly during a typical storm. The more common causes of disruption are power outages to your gateway or to T-Mobile’s towers and backhaul equipment, and post-storm network congestion as devices reconnect. Heavy rain or wet foliage can cause mild attenuation, and Low-E window coatings can worsen any weather-related dip by blocking the indoor gateway’s signal path. Keeping the gateway on a UPS and positioning it in a tower-facing window without low-E glass or metal screens will give you the best storm-weather performance.

Few things are more frustrating than when you’re in the middle of a project or a suspenseful part of a TV program, and your internet suddenly slows down. Dreaded buffering ruins your show flow. While there are several reasons for slow internet, one frequent culprit may be that your internet service provider is throttling your connection. Let’s discuss what it is, why providers do it, and the best ways to avoid this pesky problem.

Key Takeaways About Internet Throttling

  • Throttling is intentional, not accidental. When your provider slows your connection, it’s a deliberate policy decision, not a glitch, bad weather, or a Wi-Fi fluke.
  • There are three main types. Internet providers can throttle your entire connection during peak hours, target specific apps like Netflix or gaming services, or kick in automatically once you hit a monthly data cap.
  • You can test for it at home in minutes. Run a speed test without a VPN, then again with one. If your speeds improve with the VPN on, selective throttling is likely the cause.
  • The fix depends on the cause. A VPN helps with app-based throttling. Better data habits or a plan upgrade to address cap-based throttling. And if your home network is the culprit, switching ISPs won’t solve it.
  • VPNs help, but not always. A VPN can bypass activity-based throttling, but it won’t override a hard data cap, and some ISPs throttle VPN traffic itself.
  • “Unlimited” doesn’t always mean unlimited. Most unlimited plans still throttle speeds after a usage threshold is reached, especially on mobile and hotspot data.
  • Throttling is legal under federal law as of January 2025, following a court ruling that struck down FCC net neutrality protections. Some states, including California, Washington, and Oregon, still enforce their own anti-throttling laws.
  • You have recourse. If your provider isn’t delivering advertised speeds, you can file a complaint with the FCC; internet providers are required to respond.

What is ISP Throttling?

Internet throttling (or bandwidth throttling or data throttling) is when your internet service provider (ISP) deliberately slows down your upload and download speeds based on your plan, your usage, the time of day, or what you’re doing online.

Throttling isn’t the same as typical internet or Wi-Fi problems. A weak signal or unresponsive connection is usually temporary or tied to local conditions, such as your router or the weather. Throttling is an intentional policy decision made by your provider, and it can be surprisingly hard to detect on your own.

It’s worth noting that the average internet user won’t encounter throttling on a regular basis, and many providers have moved toward unlimited data options to reduce it. Still, it does happen, and knowing what it looks like can save you a lot of frustration.

How Throttling Works

Internet providers use network tools to monitor how much data your connection uses, identify the type of traffic, and slow it down or deprioritize it based on their policies. Throttling can target your entire connection or just specific activities:

  • All-traffic throttling: Your provider temporarily slows everything down, often during peak hours when the network is congested.
  • Application-based throttling: Only certain apps or services are affected, like streaming video, online gaming, and file sharing, which are common targets, while general browsing works as expected.
  • Usage-based throttling: Your connection performs normally until you hit a data cap for the billing cycle, at which point your provider reduces your speeds for the remainder of the month.

Throttling is usually mentioned in the fine print of your plan agreement, but it’s easy to miss since providers rarely make it obvious. Be sure to ask about data policies when renewing, switching, or purchasing internet service.

Suspicious? You should be.

Your ISP owes you the speeds you’re paying for.

A speed test won’t lie to you even if your ISP will. Run one now and find out if you’re actually getting what’s on your bill.

Catch my ISP in the act

How to Tell If Your Internet Connection Is Being Throttled

You don’t have to guess. Throttling tends to follow recognizable patterns, and there are simple tests you can run at home to get a clearer answer.

Common Signs of Throttled Internet vs. Normal Slow Internet

You might be dealing with throttling if:

  • Slow only during evening hours: speeds are fine in the morning but tank around 6–10 p.m.
  • Certain apps always lag: Netflix, YouTube, or games buffer even when other sites are fine.
  • Data use warning: Your speed drops off after you reach a monthly data limit.

You’re more likely dealing with “normal” slow internet if:

  • Your Wi-Fi signal is weak in certain rooms.
  • Your router or modem is several years old.
  • Too many devices are connected at once.
  • Only one website or app is slow, and other people report that it’s slow, too.

If you aren’t sure which camp you fall into, the next step is to run a simple throttling test.

Step-by-Step Test: How to Check If Your ISP Is Throttling You

You don’t need any special tools to get started. Here’s a simple 4-step test you can do at home.

Step 1: Run a Baseline Speed Test

If you can, connect your device to the router with an Ethernet cable; a wired connection is far more accurate than Wi-Fi.

  • Make sure nobody else in your household is streaming, gaming, or downloading large files.
  • Run a speed test at TestMySpeed.
  • Compare them to the advertised speeds of your plan.

You don’t have to hit your advertised speed perfectly, but if you’re getting a fraction of what you pay for, especially at different times of day, something’s off.

Step 2: Run the Same Test While Connected to a VPN

Next, you’ll run the test over again using a reputable VPN:

  • Open your VPN application and connect to a nearby server, as proximity usually means faster speeds.
  • Run the same speed test again, but this time with everything else the same, no extra streaming, and the same device.
  • Compare the VPN result to your baseline result.

If your connection is substantially faster with a VPN than without one, that can indicate that your ISP throttles certain types of traffic or services. A VPN hides what you do, making it more difficult for the ISP to single out specific apps.

Step 3: Test at Different Times of the Day

Perform both tests with and without VPN at: 

  • At peak time, usually early evening
  • Early morning or late at night; off-peak times

If your speeds only nosedive at peak times, then congestion-based throttling or network crowding is likely. If speeds are bad 24/7, it’s much more likely to be an equipment, wiring, or plan-speed issue.

Step 4: Check Your Data Usage and Plan Details

Log in to your ISP account. Look for:

  • Your data consumption for the month
  • Any data-cap limit on your plan
  • Any warnings or notes about reduced speeds after a certain amount of data

If your speeds fall off sharply after you hit that limit, that’s textbook data-cap throttling.

How Do I Stop or Reduce Throttling?

You can manage data use, upgrade your data plan, or connect through a VPN to work around throttling. And it’s worth troubleshooting your home network to rule it out as a bottleneck. Try the following tips to see if they improve slow internet issues.

If It’s Network Congestion

Congestion-based throttling is tied to peak hours, so the simplest workarounds are about timing and connection quality:

  • Schedule large downloads, game updates, and 4K streaming for off-peak hours if possible (late at night or early in the morning).
  • Use Ethernet cables for your highest-demand devices so your Wi-Fi isn’t the bottleneck.
  • Consider upgrading your speed tier so that even a throttled connection stays usable.

If It’s a Data Cap

If you’ve hit your monthly data limit, your provider may be entirely within its rights to slow you down. But here are a few ways to manage it:

  • Track your usage through your internet provider account, router app, or device settings to see what’s burning through your data. Common culprits are 4K streaming, large game downloads, and automatic cloud backups.
  • Switch from 4K to HD streaming to significantly reduce data consumption.
  • Ask your provider about higher-cap or unlimited data plans, but read the fine print carefully. Many plans advertised as unlimited still throttle speeds after you reach a certain usage threshold.
  • If you’re constantly hitting your cap and throttling is affecting your daily life, it may be worth moving to a plan that actually fits your usage. Over time, that can be cheaper than paying overage fees or dealing with degraded service.

If It’s Selective (App or Activity-Based) Throttling

If your general browsing is fine, but streaming, gaming, or torrenting always lags, your internet provider is likely targeting specific types of traffic. A virtual private network (VPN) is your best tool here. It encrypts your activity so your provider can’t identify what you’re doing and therefore can’t target it for throttling.

A VPN is most useful when:

  • Web browsing feels normal, but streaming or gaming is consistently slow.
  • The same service performs dramatically better when you’re connected to a VPN.
  • Your speed tests show improvement with the VPN on.

Keep your expectations realistic, though. A VPN won’t bypass a hard data cap because your provider can still track data consumption, but it has limited visibility of what you’re doing online. 

VPNs also add a small amount of latency because your traffic is routed through an extra server, and some ISPs throttle VPN traffic itself. A reputable paid VPN is worth the investment over a free one, which is more likely to be slow or unreliable.

Fix Common Home Network Bottlenecks

Before blaming your provider, it’s worth ruling out your home network as the source of the problem. Even if your connection is throttled, getting your home network set up properly ensures you’re squeezing every bit of speed out of it.

  • Update old equipment. An aging modem or router can cap your speeds even if your plan is faster. Check with your provider about an upgrade if you lease your modem or router.
  • Improve Wi-Fi coverage. Place your router centrally, away from thick walls and large metal appliances. If you have a large home, a mesh Wi-Fi system can eliminate dead zones far more effectively than a single router.
  • Connect priority devices with an Ethernet cable. Gaming PCs, streaming boxes, and work laptops all benefit from a wired connection.

If Your Internet Provider Won’t Help

If you’ve done your homework and you’re still not getting the speeds you pay for:

  • Call your provider directly and ask why your speeds don’t match your advertised plan. Take notes on who you spoke with and what they said.
  • File a complaint with the FCC if you believe you’re not receiving advertised service. ISPs are required to respond to FCC complaints.
  • Consider switching providers. Look for fiber, cable, or fixed wireless options in your area, and prioritize plans with no data caps or a documented history of less throttling. Providers like EarthLink are known for prioritizing network performance, CenturyLink offers DSL plans with no data caps, and Starlink can be a solid option in rural areas where other choices are limited, though its latency can be higher than wired alternatives.

When It’s Time to Switch Internet Providers

If your provider’s policies are too strict, or you’re just tired of fighting throttling, it might be time to move on.

Good reasons to switch:

  • You hit your data cap each month and get throttled for weeks.
  • You can’t get a straight answer from support about why your speeds keep dropping.
  • Competitors in your area offer no data caps or more generous terms.

Before you switch:

  • Compare the plans available in your area by speed, data cap, and price.
  • Look for unlimited or no-cap options whenever possible.
  • Beware of hidden charges and promo pricing that expires quickly.

If there is a better option out there, switching can be the cleanest long-term fix for throttling headaches. 

As of January 2, 2025, bandwidth throttling is legal at the federal level in the U.S. if ISPs follow disclosure rules. Previous FCC rules restored net neutrality, which included bans on throttling and paid prioritization. But the Sixth Circuit Court of Appeals struck down those rules on the grounds that the FCC doesn’t currently have the authority to enforce them.

As a result, there is no active nationwide ban on throttling (Reuters, January 2025). 

Depending on where you live, throttling may be restricted by your state. Some states, including California, Washington, and Oregon, have their own open-internet laws that ban throttling within the state. Those laws survived the 2025 ruling (LA Times, January 2025). 

For most users, your ISP can legally slow you down as long as they disclose this in the plan.

Don’t Let ISP Throttling Slow You Down

Internet throttling is frustrating when you’re paying for high-speed and are getting anything but. The key is to:

  • Spot the signs: slowdowns at specific times, on specific apps, or after a certain amount of data usage.
  • Test your connection: run internet speed tests with and without a VPN at various times throughout the day.
  • Know your plan: check for data caps, fine print, and ‘network management’ language in your plan details.
  • Decide what to do next: manage your data, upgrade your plan, troubleshoot issues at home, or switch providers altogether.

You deserve the speeds you’re paying for. If your current ISP keeps slowing you down, it’s worth checking what other internet options are available in your area, especially plans with higher caps or no data caps.

Throttling is a choice your ISP made. Switching is yours.

See every provider available in your area.

Enter your zip and find out which ISPs are available to you that offer better speeds, pricing, and no throttling fine print.

Compare providers

Frequently Asked Questions About ISP Throttling

Will a VPN stop throttling?

Sometimes. Throttling based on specific network activities, such as streaming or downloading, will be stopped (because the ISP cannot see what activity is happening over VPN). But some ISPs get around this by throttling all VPN connections.

Is internet throttling legal in the United States?

Yes, at the federal level. In January 2025, the Sixth Circuit Court of Appeals struck down the FCC’s net neutrality rules, removing the nationwide ban on throttling. ISPs can now legally slow your connection as long as they disclose the practice in their plan terms or broadband disclosure pages.

However, if you live in California, Washington, or Oregon, state-level open-internet laws still prohibit throttling — and those laws survived the 2025 federal ruling. Regardless of where you live, your ISP is still required to be transparent about data caps, speed thresholds, and network management practices under the FCC’s Broadband Label rules.

What’s the difference between throttling and slow internet?

Throttling is a deliberate slowdown by your internet provider, based on your plan, your usage, or what you’re doing online. Slow internet could be caused by almost anything: weak Wi-Fi, old equipment, too many devices, or even a slow website. Testing your internet speed with Ethernet, trying a VPN, and checking your plan details helps you figure out which one you’re dealing with.

Does throttling happen on mobile and hotspot data, too?

Yes, and it’s especially common on mobile plans marketed as “unlimited.” Most major carriers throttle video streaming quality by default and reduce your speeds significantly once you’ve burned through your monthly “premium data” allotment, which can be as low as 20–30GB depending on your plan. Hotspot data is often on an even shorter leash, with its own threshold that kicks in before your main data cap. If your phone’s hotspot feels sluggish, check your plan details; there’s a good chance you’ve hit a tier your carrier doesn’t advertise prominently.

Can my ISP tell I’m using a VPN, and will they throttle that too?

Yes, providers can detect VPN traffic even though they can’t see what you’re doing through it. The encrypted connection and routing pattern are recognizable. Most providers don’t throttle VPN use, but some do, particularly if you’re on a congested network or a plan with strict traffic management policies. If you notice your speeds are consistently slow both with and without a VPN, the VPN itself may be getting deprioritized. Switching to a reputable paid VPN that offers obfuscation features can help, as these are specifically designed to make VPN traffic harder to identify.

How do I find out what my ISP’s data cap and throttling policy actually is?

Start by logging into your ISP account online. Your plan details page will usually list your monthly data allowance and what happens when you exceed it. You can also check your provider’s website for their network management or broadband disclosure page, which providers are federally required to publish. If your provider participates in the FCC’s Broadband Label program (which became mandatory for most ISPs in 2024), that label will clearly list your data cap, typical speeds, and any network management practices. When in doubt, call your internet provider directly and ask specifically about data thresholds and speed reduction policies.

Smartphones are no longer just communication devices. They are the primary device through which most of the world experiences the internet. As of 2026, 7.4 billion smartphones are in active use globally, and 5.78 billion people (70.1% of the world’s population) own one (DataReportal, Digital 2026 Global Overview). 

The growth behind those numbers is still accelerating. Apple leads global market share at 20%, 5G has crossed 2.9 billion subscribers, and mobile commerce now accounts for nearly 60% of all e-commerce sales worldwide. Yet penetration varies dramatically by region, generation, and income, and how people use their phones matters as much as whether they own one. 

Here’s what you need to know. 

Key Takeaways: 2026 Smartphone Statistics 

  • 7.4 billion smartphones are in active use worldwide — more devices than people, as many individuals carry multiple phones — projected to reach 7.58 billion by the end of 2026 (DataReportal, Digital 2026 Global Overview)
  • 5.78 billion people globally use a smartphone, representing 70.1% of the world’s population (DataReportal, Digital 2026 Global Overview)
  • Apple leads global smartphone market share at 20%, followed by Samsung at 19% and Xiaomi at 13% — Apple’s third consecutive year at the top (Counterpoint Research, January 2026)
  • 2.9 billion global 5G subscriptions as of end-2025, about one-third of all mobile connections worldwide, and is forecast to reach 6.4 billion by 2031 (Ericsson Mobility Report, Q4 2025)
  • 21.1 billion IoT devices are connected globally in 2025, growing 14% year-over-year, projected to reach 39 billion by 2030 (IoT Analytics, October 2025)
  • Mobile devices account for 62.23% of global web traffic, with smartphones driving 59–60% of total global e-commerce sales (Statcounter; Statista, 2025)
  • 97% of U.S. adults aged 18–49 own a smartphone, compared to 76% of those 65 and older (Pew Research Center, 2025)

1. Global Smartphone Market Growth: Key Stats for 2026 

As of early 2026, there are approximately 7.4 billion smartphones worldwide, accounting for roughly 87% of all mobile phones. This number is projected to reach 7.58 billion by the end of 2026. That figure exceeds the number of people who own them, since many individuals carry multiple devices, and some are held as spares or for business use. The number of unique smartphone users globally is estimated at approximately 5.7 billion (DataReportal, Digital 2026 Global Overview).  

This rapid growth shows how mobile technology is evolving, especially with the rise of 5G networks and advancements in mobile technology. Mobile app stores continue to generate billions each year, and investments in smartphone innovation remain robust, with companies aiming to become the next leaders in an incredibly dynamic market.  

Comparatively, 8.31 billion mobile phones are currently in use worldwide. Exactly how quickly they’ll shift to a smartphone remains to be seen, but it will likely be as soon as they can afford it and have access to the technology.  

2. Smartphone Usage Habits in 2026: How Much Time Do People Spend on Their Phones? 

Smartphones have become essential to modern life, so much so that many people feel dependent on their phones. It’s rare to find someone without a mobile device, and the average U.S. adult spent 4 hours and 2 minutes per day on internet activities using a smartphone in 2025. This dependency is more pronounced among 18-29-year-olds, 97% of whom own a smartphone.  

Smartphones aren’t just for communication; they’re integral to everything from mobile shopping to entertainment and work-related tasks. It’s no surprise that the average smartphone user checks their device 58 times a day, an increase from previous years. This trend indicates the growing reliance on smartphones for everything, from managing daily tasks to quick social media updates.  

Interestingly, smartphones are also replacing other electronic devices. While laptops and desktops remain relevant for heavy computing, smartphones have taken the lead in many categories, such as mobile shopping, where purchases made on smartphones continue to surge.  

3. Demographics of Smartphone Use: Who’s Using Smartphones in 2026? 

While smartphone ownership is widespread in many parts of the world, there’s still substantial growth potential in emerging markets. Approximately 5.7 billion people worldwide use a smartphone, representing about 70% of the global population, according to DataReportal’s Digital 2026 Global Overview.  

Let’s break down smartphone usage by demographic:  

  • Age: Younger generations (18-29 years old) are the most active smartphone users. In fact, 97% of U.S. adults in this age group use a smartphone, while only 76% of those 65 and older do.
  • Income: Smartphone ownership varies by household income, though the gap has narrowed significantly. In the U.S., 98% of adults in households earning $100,000 or more own a smartphone, compared to 76% of those earning less than $30,000 — yet lower-income Americans are far more likely to be smartphone-dependent, relying on their device as their only means of internet access (Pew Research Center, 2025).
  • Geography: Countries like Indonesia, Nigeria, and Vietnam are seeing rapid adoption rates, which are expected to further fuel the global smartphone market. Asia remains a focal point for mobile user growth, with China leading, but companies will also need to adapt to local needs and affordability to expand their reach effectively.

4. 5G Technology and the Future of Smartphones in 2026 

Global 5G subscriptions surpassed 2.9 billion by the end of 2025, which is roughly one-third of all mobile subscriptions worldwide, confirming 5G as the fastest-growing mobile technology in history. This enhanced connectivity is driving new opportunities for smartphones, such as faster downloads, improved mobile gaming experiences, and increased reliance on mobile for work and entertainment.  

Smartphones are also playing a pivotal role in the Internet of Things (IoT), connecting with smart devices from home security systems to wearables and beyond. As of 2025, the number of connected IoT devices is growing 14% year-over-year, reaching approximately 21.1 billion globally, with smartphones serving as the primary user interface for managing many of these devices.  

5. Phones vs Other Electronics: Why Smartphones Are Dominating 

When comparing phones vs other electronics, smartphones have become the dominant device for daily internet use. As of mid-2025, mobile devices accounted for approximately 62.23% of global web traffic, with desktops contributing around 35% and tablets just 2%. In the U.S., 63% of adults aged 18 to 29 say they are online almost constantly, and 21% of that age group primarily use mobile devices; over 70% rely solely on their smartphone for internet access. Tablets and computers remain important for longer-form tasks, but for browsing, social media, shopping, and financial management, the smartphone has become the default screen for most of the world. 

6. Smartphone Addiction: How Phone Dependency Is Changing Our Lives 

Smartphone addiction is a growing concern in the digital age, with many individuals spending excessive time on their devices. As we become more reliant on our phones, issues such as mental health problems, sleep deprivation, and reduced productivity are emerging as side effects of phone dependency. In fact, 87% of smartphone users check their phones within one hour of going to bed, and 69% check them within five minutes of waking up.  

7. The Rise of Mobile Shopping: A Key Driver of Smartphone Growth 

The mobile shopping industry is booming, with smartphones becoming the primary device for purchasing goods online. Mobile commerce accounted for approximately 59–60% of total global e-commerce sales in 2025. This shift in consumer behavior is driven by the convenience of shopping on the go and the growing availability of mobile payment systems such as Apple Pay and Google Wallet.  

8. Social Media and Smartphones: The Perfect Match 

Smartphones have revolutionized how we use social media. With apps like Instagram, TikTok, and Facebook at our fingertips, smartphones have made access to social media more ubiquitous than ever. The rise of mobile-only social platforms has further fueled the shift towards smartphones as our main digital interface.  

  • Usage Trends: More than 99% of social media users access platforms via mobile devices, a figure that has steadily increased year over year.  

Smartphones Won. Now What? 

Smartphones have already won. With 7.4 billion devices in active use, 63% of global web traffic running through mobile, and nearly 60% of all e-commerce happening on a handset, the smartphone isn’t competing for centrality in daily life. It has it. 

What comes next is more interesting than the growth story. On-device AI is reshaping how people search and shop. 5G is extending connectivity into 21 billion IoT devices and counting. And the 30% of the world still without a smartphone represents both the largest remaining growth opportunity in consumer technology and one of the most consequential equity challenges of the decade. 

For businesses, mobile-first is no longer a strategy; it’s the baseline. For the billions still entering the smartphone market for the first time, it’s a gateway to healthcare, education, and economic opportunity. The numbers in this guide will change. The underlying reality they reflect won’t.

Frequently Asked Questions: 2026 Smartphone Statistics

How many people use smartphones worldwide?

Approximately 5.7 billion people worldwide use a smartphone, representing about 70% of the global population, according to DataReportal’s Digital 2026 Global Overview. The total number of active smartphone devices globally is higher, around 7.4 billion, because many users own more than one device. That figure is projected to reach 7.58 billion by the end of 2026.

How much time does the average person spend on their smartphone per day?

The average person spends approximately 3 hours and 45 minutes per day on smartphone internet activity globally, rising to around 4 hours and 2 minutes per day among U.S. adults in the United States. Self-reported total phone time reaches 5 hours and 16 minutes per day among American adults surveyed by Harmony Healthcare IT in late 2024. 

Which smartphone brand has the largest market share in 2025?

Apple led the global smartphone market in 2025 with a 20% market share, followed closely by Samsung at 19% and Xiaomi at 13%, according to Counterpoint Research’s full-year 2025 data published in January 2026. It marked Apple’s third consecutive year as the world’s largest smartphone vendor by shipments, driven largely by strong iPhone 17 demand in emerging markets. Vivo and OPPO each held 8%, with all other brands accounting for the remaining 32%.

How many 5G connections are there worldwide?

Global 5G subscriptions reached approximately 2.9 billion by the end of 2025, about one-third of all mobile subscriptions worldwide. Ericsson forecasts 5G subscriptions will reach 6.4 billion by 2031, representing two-thirds of all mobile subscriptions globally.

What percentage of e-commerce sales happen on smartphones?

Mobile commerce accounts for approximately 59–60% of total global e-commerce sales in 2025 (Statista), with mobile devices driving around 65% of e-commerce traffic globally. More than two-thirds of weekly social media users have made a purchase after seeing a product on a platform, according to a LendingTree survey (December 2025), and 76% of Americans have made an online purchase via smartphone. In the US specifically, m-commerce sales are projected to reach $856.4 billion by 2027.

How many IoT devices are connected worldwide, and what role do smartphones play?

The number of connected IoT devices reached approximately 21.1 billion globally in 2025, growing 14% year-over-year, a figure that is expected to reach 39 billion by 2030. Smartphones serve as the primary user interface for managing the majority of these connected devices, from smart home systems and wearables to connected vehicles and industrial sensors.

How does smartphone ownership vary by age group?

Smartphone ownership skews heavily toward younger adults. In the United States, 97% of adults aged 18 to 49 own a smartphone, compared to 76% of those aged 65 and older, according to Pew Research Center’s 2025 Mobile Fact Sheet. Globally, smartphone penetration in developed markets broadly exceeds 90% among adults aged 18 to 49, while the overall global average across all ages sits at approximately 70% of the world population (DataReportal, 2026).

In the first quarter of 2024, 35.5 million Americans teleworked at least part of the time, representing 22.9 percent of the workforce (Bureau of Labor Statistics, March 2025). If you spend your day on Zoom calls, syncing files to the cloud, or accessing a corporate VPN, your internet connection is as critical as any other tool you use. This guide breaks down exactly what speeds remote workers need in 2026, organized by activity, worker type, and household size, so you can stop guessing and start working without interruption. 

Key Takeaways: Internet Speeds for Remote Workers in 2026 

  • The FCC’s broadband minimum is now 100 Mbps download speed and 20 Mbps upload speed.
  • Upload speed is often the bottleneck for remote workers. Always check the upload figure in your plan details, not just the headline download number.
  • Zoom, Teams, and Google Meet each require 3-4 Mbps upload speed per user for HD calls. Budget 5-10 Mbps per person in real-world use; more if you screen share.
  • Two remote workers on simultaneous HD calls need at least 200 Mbps down and 50 Mbps up. Add up peak usage across every active device, then add 25 percent for background traffic.
  • Latency can matter more than raw speed. Target under 50 ms for video conferencing and under 20 ms for VoIP. A fast connection with high latency will still underperform on calls.
  • Fiber is the ideal internet option for remote work, but cable works for most. Fiber’s symmetrical upload speeds are a clear advantage for most work-from-home tasks, such as video calls, file uploads, and collaborative docs.
  • Starlink is now a viable option for rural remote workers. With 100 to 170 Mbps downloads and 20 to 50 ms latency in 2026, it handles HD video and cloud tools. Test VPN performance before committing.
  • Ethernet beats Wi-Fi for remote work. A wired connection means lower latency and fewer dropped calls. If you cannot run a cable, use a Wi-Fi 6 router and work as close to it as possible.
  • A mobile hotspot is your easiest internet backup. Most major carrier plans have enough hotspot data to cover a full workday. Test it before you need it.
  • Run a speed test before upgrading your plan. The problem may be your router or Wi-Fi, not your plan. Test during peak work hours for an accurate read.

Choppy video and audio during video calls?

Smooth video conferencing depends on stable internet.

<50 Mbps

Great for individuals to browse the internet, check email, and other basic browsing.

50-100 Mbps

Great for streaming Netflix, videos, and online meetings.

100-200 Mbps

Great for streaming high quality videos, fast downloads, video games, and multiple devices.

200+ Mbps

Great for doing almost anything at ultra fast speeds.

What Is a Good Internet Speed for Remote Work? 

The best internet speed for remote work depends on what you do, how many people share your connection, and what tools your employer requires. Basic tasks, such as using cloud-based apps and handling emails, don’t require much bandwidth, but video calls, cloud syncs, and large file transfers have greater demands.

Minimum Speed for Remote Workers 

For a single remote worker handling email, video calls, and cloud-based apps, we recommend minimum speeds of at least 25 Mbps download and 5 Mbps upload. This is enough for one HD video call and general browser-based tasks simultaneously. But it is not enough for much else on the network or for other users. 

For most remote workers, we recommend a plan with at least 100 Mbps download speed and 20 Mbps upload speed. These are enough for HD video conferencing, cloud file sync, and general household internet use, with adequate performance for each. These speeds align with the Federal Communications Commission (FCC) broadband definition (100 Mbps download and 20 Mbps upload) for fixed broadband services.

Your home office deserves better than “good enough.”

Find out if your internet is actually built for remote work.

The recommended speeds are right there in the article. Now find out if your connection is hitting them.

Test my work-from-home speed

Why Upload Speed Matters for Remote Work 

Download speed controls how fast data comes to you, and it is the speed highlight in their plan tiers. Upload speed controls how fast data leaves your device and is much harder to identify in an internet plan. But for most of your remote work tasks, such as video calls, sending large files, screen sharing, and using collaborative tools like Google Docs, Notion, or SharePoint, a fast upload speed is essential.

Most internet plans’ upload speeds are much slower than download speeds. For instance, a cable internet plan advertised as 300 Mbps may only include 10 to 20 Mbps upload. For a single remote worker or household user, this can be enough. But if you have two people sharing your internet connection, it may not be enough and affect performance. Fiber internet, by contrast, offers symmetrical speeds (equal download and upload speeds), which is why we recommend it for remote workers, if it’s available in your area. 

Worker Type Min Upload Recommended Upload Notes 
Email, most web-based apps, chat 5 Mbps 10 Mbps Light usage; most plans easily cover this 
Video conferencing (daily) 10 Mbps 20 Mbps Matches the 2024 FCC broadband standard
Developer / IT (VPN + cloud) 20 Mbps 50 Mbps Latency matters as much as raw speed 
Designer/content creator25 Mbps 100 Mbps Large file uploads; fiber strongly preferred 
Video editor/media producer50 Mbps 200+ Mbps Fiber or multi-gig only 

Internet Speed Requirements by App 

The speeds in the table below are minimum bandwidth requirements and may not account for other activities or users on your network. 

App / Tool Min Download Min Upload Recommended Download Recommended Upload 
Zoom (HD group call) 3.0 Mbps 3.8 Mbps 10 Mbps 10 Mbps 
Microsoft Teams (HD video) 1.5 Mbps 1.5 Mbps 8 Mbps 5 Mbps 
Google Meet (HD group call) 3.2 Mbps 3.2 Mbps 8 Mbps 8 Mbps 
Slack 0.5 Mbps 0.5 Mbps 3 Mbps 3 Mbps 
VPN 5 Mbps 5 Mbps 25 Mbps 25 Mbps 
Cloud file sync (Drive, Dropbox, OneDrive) 5 Mbps 10 Mbps 25 Mbps 25 Mbps 
Screen sharing + 2 Mbps + 2.5 Mbps + 5 Mbps + 5 Mbps 
Sources: Zoom Support, Microsoft Teams documentation, Google Meet Help, Slack documentation

Note: These speeds are for one user. If there are multiple users in your household, multiply the speeds by the number of users. Add an additional 25% for any background activities, like cloud sync, OS updates, and other connected devices. 

How to Calculate Your Household’s Total Speed Needs 

The most common causes of sluggish internet are the number of users and devices using your home network. If this is the case for you, add up each person’s usage demands, then add 25 percent overhead for other activities on your network and Wi-Fi congestion.

Example: Two users each on HD Zoom calls (10 Mbps each) plus two kids streaming HD video (8 Mbps each) plus a smart TV and a gaming console in standby (5 Mbps combined) = 41 Mbps download, 21 Mbps upload at peak. Add 25 percent overhead, and you need roughly 55 Mbps down and 28 Mbps up.

Bandwidth by Household Composition 

Household Profile Min Recommended Plan Ideal Plan 
1 remote worker, light-use household 50 / 10 Mbps 100 / 20 Mbps 
1 remote worker, active household (streaming, gaming) 100 / 20 Mbps 200 / 50 Mbps 
2 remote workers, 2 or more kids 200 / 50 Mbps 500 / 100 Mbps 
2 remote workers with heavy upload needs 300 / 100 Mbps Gigabit fiber 
Home office with 3 or more workers or a home studio 500 / 100 Mbps Multi-gig fiber 

How Latency Affects Remote Work Activities 

Latency is the time (measured in milliseconds) it takes for a data packet to travel from your device to a server and back. The lower the latency, the smoother and more responsive your connection will be. High latency can cause audio sync issues on calls, choppy video, sluggish responses in cloud-based apps, and lag when accessing a corporate VPN or virtual desktop.

Ideal Latency Targets by Task 

Higher latency causes an audible delayTarget Latency Acceptable Max Notes 
VoIP / phone calls 20 ms or less 50 ms or less Higher latency causes audible delay 
HD video conferencing 50 ms or less 100 ms or less Above 100 ms causes noticeable lag 
Corporate VPN access 50 ms or less 80 ms or less VPN adds 5 to 20 ms on its own 
Cloud desktop (Citrix, Azure VDI) 30 ms or less 60 ms or less Latency affects keyboard/mouse response 
General cloud apps (SaaS) 80 ms or less 150 ms or less Most tools degrade above 150 ms 
Video streaming (Netflix, YouTube) 150 ms or less 300 ms or less Buffered; latency matters less 

Which Connection Types Have the Best Latency? 

Connection Type Typical Latency Remote Work Suitability 
Fiber 1 to 10 ms Excellent for all use cases 
Cable 10 to 30 ms Very good for most remote workers 
5G Home Internet 10 to 30 ms Good; it can vary by tower congestion
DSL 25 to 60 ms Acceptable for light use only 
LEO satellite 20 to 50 ms Good for rural workers; VPN adds latency 
GEO satellite 500 to 800 ms Not suitable for video calls or VPN 

Best Internet Connection Types for Remote Workers 

The type of internet connection you have affects not just speed, but reliability, upload performance, and latency. Here is how the main options compare for remote work in 2026. 

Connection Typical Download Typical Upload Latency Remote Work Rating 
Fiber 300 Mbps to 2 Gbps 300 Mbps to 2 Gbps 1 to 10 ms Excellent 
Cable 100 Mbps to 1.2 Gbps 10 to 50 Mbps 10 to 30 ms Very Good 
5G Home Internet 100 to 300 Mbps 20 to 80 Mbps 10 to 30 ms Good 
Starlink (LEO) 100 to 300 Mbps 10 to 30 Mbps 20 to 50 ms Good (rural) 
DSL 10 to 100 Mbps 1 to 10 Mbps 25 to 60 ms Fair (light use) 
Legacy Satellite 25 to 100 Mbps 3 to 10 Mbps 500 to 800 ms Poor 

Fiber Internet Fiber offers symmetrical upload and download speeds, the lowest latency of any wired connection, and minimal neighborhood congestion. If it is available in your area, it is the best choice for remote work when available. 

Cable Internet: Cable is the most widely available internet option in the US and works well for most remote workers. Its lower upload speed is its key limitation. If you have multiple users and remote workers in your home, opt for a plan with the fastest upload speed to avoid sluggishness and frustration.

5G Home Internet: Fixed 5G home internet delivers 100 to 300 Mbps download speeds with 10 to 30 ms latency, making it a solid and often more affordable alternative to cable. The main drawback of 5G home internet is performance variability; speeds depend on how close your home is to the tower and can fluctuate at peak hours.

LEO Satellite Internet: Low Earth orbit (LEO) satellite internet has made satellite a viable option for remote work in rural and underserved areas. Because of its lower orbit (250 – 500 miles), LEO satellite is capable of download speeds up to 220 Mbps, upload speeds between 10 – 30 Mbps, and average latency of 25-60. While its upload speeds aren’t ideal, LEO satellite internet is a welcome option where others aren’t available for remote workers in rural areas.

GEO Satellite Internet: Traditional geostationary equatorial orbit (GEO) satellite internet offers peak download speeds of 150 Mbps and high latency of 500 to 800 ms due to its high-altitude orbit (about 22,000 miles). This makes it unsuitable for video conferencing, VoIP, or VPN access. It’s a last-resort option for remote workers in areas with no other service, and only for basic tasks like email and browsing.

DSL Internet: DSL is a legacy technology that most providers are phasing out. Speeds and upload performance are insufficient for modern remote work, but may struggle to support demanding tasks and multi-user households. We’d recommend choosing LEO satellite or 5G home internet over DSL, if they’re available in your area.

What to Look for in an Internet Plan for Remote Work 

Beyond speed, a few specific plan features make a meaningful difference in day-to-day remote work performance. 

Symmetrical Upload and Download Speeds 

Symmetrical plans, most common among fiber providers, offer the same speed in both directions. When comparing plans, always check the upload speed in the plan details.

Unlimited Data 

Plans with data caps can result in throttled speeds and overage fees. Look for plans with unlimited data or verify that your expected monthly usage falls well within the data limit. 

Low Latency 

In addition to download and upload speeds that fit your needs, keep latency in mind. Fiber and cable from established providers consistently outperform those from other providers on reliability metrics.

Your Remote Work Internet Speed 

For most remote workers in 2026, a plan with 100 Mbps download and 20 Mbps upload is the minimum worth targeting. This aligns with the FCC’s current broadband standard and covers the bandwidth demands of daily video conferencing, cloud collaboration, and multi-device households. If your role involves heavy file uploads, video production, or constant VPN access, aim for faster speeds: 200 to 500 Mbps with symmetrical or near-symmetrical upload speeds, ideally on a fiber connection.

Before shopping for a new plan, run a speed test to see what you’re getting from your current connection. If you are consistently hitting your plan’s advertised speeds but still experiencing issues, the bottleneck is likely your router, Wi-Fi setup, or latency. If this is the case, we recommend restarting your modem and router, updating firmware, or moving your Wi-Fi router to a central location in your home to resolve slow internet issues.

Remote work runs on internet. Make sure yours can handle it.

One test tells you everything your home office needs to know.

TestMySpeed checks your download, upload, and latency in real time, the three numbers every remote worker needs to know before the next video call.

Run a free speed test

FAQs: Best Internet Speed for Remote Workers

What is the minimum internet speed for working from home?

For a single remote worker, the minimum recommended speed is 25 Mbps download and 5 Mbps upload for light use such as email, chat, and basic web browsing. The FCC defines broadband as having 100 Mbps download and 20 Mbps upload speeds. We recommend these as the minimum speed you should get to support most common work from home tasks, as well as other activity on your home network.

Is 50 Mbps fast enough for remote work?

For a single remote worker on standard HD video calls and cloud apps, 50 Mbps download speed is workable. The more critical factor is upload speed. If your 50 Mbps plan includes only 5 to 10 Mbps upload, you may experience degraded video quality or choppy audio during calls, especially if other devices are active on the network at the same time. A plan with 50 Mbps download and 20 Mbps upload will perform significantly better than one with 50 Mbps down and 5 Mbps up.

What upload speed do I need for Zoom?

Zoom’s official minimum for a 1080p HD group call is 3.8 Mbps upload. In practice, 5 to 10 Mbps upload is recommended to account for fluctuations in network conditions and concurrent background activity. If you screen share during calls, add another 2 to 3 Mbps to that figure.

Does latency matter more than speed for remote work?

For most remote workers, both matter but in different ways. Raw speed determines how quickly files transfer and how smoothly video streams. Latency determines how responsive your connection feels during real-time interactions like video calls, VoIP, and cloud-hosted applications. A 100 Mbps connection with 20 ms latency will perform better on video calls than a 200 Mbps connection with 100 ms latency. If your work involves heavy VPN use, cloud desktops, or VoIP, prioritize a low-latency connection type such as fiber or cable over a high-speed but higher-latency option like GEO satellite internet.

Is fiber better than cable for working from home?

For most remote workers, yes. Fiber offers symmetrical upload and download speeds, lower latency, and more consistent performance during peak hours compared to cable. The practical difference is most noticeable for workers who frequently video conference, upload large files, or use VPN access. If fiber is available at a comparable price to cable in your area, it is the better choice for remote work. If fiber is not available, cable from a reputable provider is a solid alternative for the majority of use cases.

How much speed do I need if multiple people work from home?

A household with two remote workers each on daily HD video calls should target at least 200 Mbps download and 50 Mbps upload to avoid bottlenecks. Add the needs of other household members streaming video, gaming, or attending school online and you may need 300 Mbps or more. Use the bandwidth calculator approach described in the multi-household section of this guide: add the simultaneous peak usage of every active device, then add 25 percent overhead for background traffic.

Can I use Starlink for remote work?

Yes, with some caveats. Starlink now delivers median download speeds around 100 to 170 Mbps with latency of 20 to 50 ms in 2025 and 2026, which is sufficient for HD video conferencing, cloud tools, and general business applications. For workers who rely heavily on corporate VPN or cloud virtual desktops, test your specific VPN setup over Starlink before committing, as VPN tunneling adds latency on top of the baseline. For rural workers with no fiber or cable access, Starlink is an excellent primary connection option.

Should I use Wi-Fi or Ethernet for working from home?

Ethernet is almost always the better choice for remote work if your setup allows it. A wired connection eliminates the interference, signal drop, and variable speeds that come with Wi-Fi, resulting in lower latency, more consistent throughput, and fewer dropped call incidents. If running a cable to your desk is not practical, a Wi-Fi 6 or Wi-Fi 6E router in the same room as your workspace offers the next best option. Reserve Ethernet for your most critical device, typically the computer you use for video calls and virtual private networks (VPN) access.

Have you ever wondered how much data you’re using when streaming your favorite shows or music, gaming online, or downloading game files and updates?  

  • Streaming video uses between 1 GB and 10+ GB per hour, depending on quality.
  • Gaming can demand 50–150 GB in a single download.

If you’re on a capped internet plan or just trying to avoid a surprise data overage fee, understanding where you use the most data helps you manage usage. 

In this article, we’ll show you how much data streaming and gaming consume, platform by platform and quality setting by quality setting. You’ll find per-hour usage figures for Netflix, YouTube, Disney+, Hulu, Amazon Prime, Spotify, Apple Music, and Twitch, plus real-time gaming data and massive game downloads. We also cover recommended internet speeds, internet provider data caps, and practical tips to cut your usage without sacrificing quality.

How Much Data Does Streaming Use? 

The amount of data streaming uses depends almost entirely on the video or audio quality you’re using. Higher resolution and higher bitrate (the amount of data streamed per second) mean more data, and the difference between SD and 4K is significant. Streaming a single 4K movie can use as much data as 10 hours of HD streaming. Here’s what you can expect across all major quality tiers and platform types. 

Video Streaming Data Usage by Quality 

Video resolution is the biggest driver of data consumption. The figures below reflect per-hour usage across major streaming platforms and are consistent with published guidelines from Netflix, YouTube, and Amazon Prime Video. 

Video Quality Resolution Avg. Data Per Hour Notes 
Requires a fast connection; heavy on data caps 480p 0.7 – 1 GB Default for limited and mobile data plans 
High Definition (HD) 720p 1.5 – 2 GB Good balance of quality and data use 
Full HD (FHD) 1080p 2.5 – 3 GB Most common default on desktop and TV 
Ultra HD / 4K 2160p 7 – 10 GB Rare; requires an 8K display and very high speeds 
8K 4320p 20 – 30 GB Rare; requires 8K display and very high speeds 
Quick reference: On a 1 TB data cap, streaming in HD for 2 hours per day will consume roughly 180 GB/month. The same habit in 4K pushes that to 420–600 GB/month. 

Music Streaming Data Usage by Quality 

Music streaming uses a fraction of the data that video does, but the quality tier still makes a meaningful difference, especially for audiophiles streaming lossless or hi-res audio. 

Platform Quality Tier Bitrate Approx. Data Per Hour 
Spotify Low 24 kbps 11 MB 
Spotify Normal 96 kbps 43 MB 
Spotify High 160 kbps 72 MB 
Spotify Very High (Premium) 320 kbps 144 MB 
Apple Music High Quality (AAC) 256 kbps 115 MB 
Apple Music Lossless 24-bit/48 kHz 1.5 GB 
Apple Music Hi-Res Lossless 24-bit/192 kHz 8.7 GB 
Tidal Normal 96 kbps 43 MB 
Tidal High 320 kbps 144 MB 
Tidal HiFi (Lossless/FLAC) 1,411 kbps 635 MB 
Tidal Max (Hi-Res FLAC / Dolby Atmos) Up to 9,216 kbps 4 GB 
Sources: Spotify, Apple, and Tidal. 

Standard music streaming at high quality (320 kbps) uses roughly 144 MB per hour, which is less than 3 minutes of 4K video streaming. Music is rarely the culprit of high data use, unless you’re streaming hi-res lossless audio. 

Live Streaming Data Usage 

Live streaming is different from on-demand video. Because content is transmitted in real time with no opportunity for pre-buffering or compression optimization, live streams typically consume more data per hour than on-demand content at equivalent resolution. The figures below reflect viewer-side data consumption (i.e., what you use when watching a live stream, not broadcasting one). 

Platform Stream Quality Approx. Data Per Hour (Viewer) 
Twitch 480p (SD) 0.6 – 0.9 GB 
Twitch 720p (HD) 1.3 – 2.0 GB 
Twitch 1080p (Full HD) 2.5 – 3.5 GB 
YouTube Live 720p 1.3 – 1.5 GB 
YouTube Live 1080p 2.5 – 3.0 GB 
YouTube Live 4K 8 – 12 GB 
Sources: Twitch and YouTube. Data are based on published bitrate guidelines converted to GB/hr. 

Live vs. on-demand: At equivalent resolutions, live streams typically consume 15–30% more data than on-demand content on the same platform, due to the absence of advanced compression and adaptive pre-buffering used by on-demand systems.

Data Usage by Streaming Platform 

Data consumption varies by platform because each service uses different compression technology, default quality settings, and bitrate profiles. The table below gives you a quick-reference summary across every major platform, followed by a detailed breakdown for each one. 

Comparing Streaming Platforms and Data Usage 

Platform SD HD (720p–1080p) 4K / Ultra HD 
Netflix 1 GB/hr 3 GB/hr 7 GB/hr 
YouTube 0.3 GB/hr 1.5 GB/hr 4 GB/hr 
Amazon Prime Video 0.45 GB/hr 2.25 GB/hr 6–7 GB/hr 
Disney+ 0.7 GB/hr 2 GB/hr 7 GB/hr 
Hulu (on-demand) 0.65 GB/hr 1.3 GB/hr N/A 
Hulu (Live TV) N/A 3.5 GB/hr N/A 
Twitch 0.7 GB/hr 1.5–2 GB/hr N/A 
Spotify N/A 43–144 MB/hr N/A 
Apple Music N/A 115 MB/hr N/A 
Note: All figures reflect viewer-side download consumption. Actual usage may vary based on your device, network conditions, and adaptive bitrate adjustments. 

Netflix 

Netflix offers four manual quality tiers plus an Auto setting, which defaults to the highest quality your connection can sustain.  

Quality Setting Approx. Data Per Hour 
Auto Varies; up to 7 GB/hr on supported plans 
Low (SD) 1 GB/hr 
Medium (HD) 3 GB/hr 
High (Full HD / 4K) Up to 7 GB/hr 
Source: Netflix 

Binge-watching math: Streaming Netflix in HD for 3 hours per day adds up to roughly 270 GB per month, which is well within a 1 TB cap on its own, but significant when combined with other household usage. 

YouTube 

YouTube uses adaptive bitrate streaming by default, meaning quality adjusts automatically based on your connection. 

Quality Setting Resolution Approx. Data Per Hour 
144p 144p 0.07 GB/hr 
240p 240p 0.13 GB/hr 
360p 360p 0.25 GB/hr 
480p (SD) 480p 0.3 GB/hr 
720p (HD) 720p 0.9 GB/hr 
1080p (Full HD) 1080p 1.5 GB/hr 
1440p (2K) 1440p 2.7 GB/hr 
2160p (4K) 2160p 4 GB/hr 
Source: YouTube 

Note: YouTube’s 4K figure (~4 GB/hr) is lower than Netflix’s (~7 GB/hr) because YouTube uses more efficient codecs (software that compresses and decompresses video and audio). 

Amazon Prime Video 

Amazon labels its quality tiers differently from most platforms, using “Good,” “Better,” and “Best” rather than SD, HD, or 4K. 

Quality Label Equivalent Approx. Data Per Hour 
Good SD (480p) 0.45 GB/hr 
Better HD (720p–1080p) 2.25 GB/hr 
Best Full HD / 4K Ultra HD 6–7 GB/hr 
Source: Amazon 

Disney+ 

Disney+ supports SD, HD, and 4K Ultra HD with an Auto setting. It also supports Dolby Vision and HDR10 (premium and standard HDR (picture quality) formats), which can push 4K usage toward the higher end of the range. 

Quality Setting Approx. Data Per Hour 
Auto Adjusts to connection, up to 7 GB/hr 
SD 0.7 GB/hr 
HD 2 GB/hr 
4K Ultra HD 7 GB/hr 
Source: Disney+ 

Hulu 

Of the platforms we cover in this article, Hulu is the only one that draws a meaningful distinction between on-demand and live TV data usage. The gap is significant. Live TV requires real-time data transmission without compression optimization, which noticeably increases usage. 

Content Type Quality Approx. Data Per Hour 
On-Demand SD 0.65 GB/hr 
On-Demand HD 1.3 GB/hr 
Live TV HD 3.5 GB/hr 
Source: Hulu 

On-demand vs. live TV: Hulu Live TV in HD uses nearly three times more data than Hulu on-demand in HD. This is significant if you’re on a capped plan, especially if you use Hulu as a cable TV replacement. 

Spotify 

Spotify’s data usage is determined by the audio quality tier, with the gap between free-tier streaming and Premium Very High quality being roughly 13x higher. 

Quality Tier Bitrate Approx. Data Per Hour 
Low (Free/Data Saver) 24 kbps 11 MB/hr 
Normal 96 kbps 43 MB/hr 
High 160 kbps 72 MB/hr 
Very High (Premium) 320 kbps 144 MB/hr 
Source: Spotify 

Data saver tip: Downloading playlists over Wi-Fi for offline playback eliminates ongoing data consumption entirely — a worthwhile habit if you replay the same tracks regularly. 

Apple Music 

Apple Music offers the widest range of audio quality of any music streaming service, from standard AAC all the way to Hi-Res Lossless at 24-bit/192 kHz. Data use differences are dramatic. 

Quality Tier Format Bitrate Approx. Data Per Hour 
High Quality (default) AAC 256 kbps 115 MB/hr 
Lossless ALAC 24-bit/48 kHz 1.5 GB/hr 
Hi-Res Lossless ALAC 24-bit/192 kHz 8.7 GB/hr 
Source: Apple 

Important: Hi-Res Lossless at 8.7 GB/hr uses more data per hour than 4K Netflix. Most listeners won’t notice the difference on typical speakers or earbuds, so it’s better to use it for home listening on high-quality audio equipment. 

Twitch 

Twitch is a live-streaming platform, so it streams in real time without the compression benefits of on-demand delivery. Maximum viewer-side resolution is capped at 1080p for most streams. 

Stream Quality Resolution Approx. Data Per Hour 
Low 480p 0.6–0.9 GB/hr 
Medium 720p 1.3–2.0 GB/hr 
High / Source 1080p 2.5–3.5 GB/hr 
Source: Twitch 

Twitch vs. Netflix at 1080p: Twitch at 1080p uses roughly 2.5–3.5 GB/hr, compared to Netflix HD at 3 GB/hr, which is comparable, but Twitch’s real-time transmission means less buffer tolerance if your connection drops. 

How Much Data Does Online Gaming Use? 

Gaming has a data reputation problem. Most people assume it’s a bandwidth hog, but it depends on how you’re gaming. Real-time online multiplayer uses little data. Cloud gaming, on the other hand, behaves like video streaming and can consume as much as 4K Netflix. And game downloads are in a category of their own. Here’s how each scenario breaks down. 

Online Multiplayer Gaming — Bandwidth vs. Data 

This is where most people’s assumptions are wrong. When you play an online multiplayer game, your device isn’t streaming video. It sends and receives small packets of game state data: player positions, actions, scores, and events. Typical online gameplay consumes anywhere from 40 MB to 300 MB per hour on PC or console, which is a fraction of what even SD video streaming uses. 

The key metric that matters for online gaming isn’t data, it’s latency (ping). Low latency with modest internet speeds will always outperform a high-speed connection with high latency for online play. 

Game Genre Approx. Data Per Hour 
Minecraft Sandbox / Survival 40 MB/hr 
World of Warcraft MMORPG 40 MB/hr 
Fortnite Battle Royale 50–100 MB/hr 
League of Legends MOBA 45–100 MB/hr 
FIFA / EA Sports FC Sports 50–100 MB/hr 
Call of Duty: Warzone Battle Royale / FPS 100–160 MB/hr 
Apex Legends Battle Royale 100–150 MB/hr 
Destiny 2 FPS / MMO 200–300 MB/hr 
Counter-Strike 2 Competitive FPS 100–250 MB/hr 
Figures reflect active online gameplay only. Voice chat via Discord or in-game VOIP adds approximately 50+ MB/hr on top of these estimates. 

Even the most data-intensive online game (Destiny 2 at about 300 MB/hr) uses less data per hour than 20 minutes of SD streaming on Netflix. Gameplay is rarely a data hog. Downloads and updates are. 

What increases gaming data usage: 

  • Voice chat: adds about 50 MB/hr per additional player on the call
  • Background updates: game launchers like Steam and the PlayStation Network frequently download patches while you play
  • Asset streaming: Some open-world games stream environment data in real time, pushing usage toward the higher end of the range

Cloud Gaming Data Usage 

Cloud gaming services like Xbox Cloud Gaming, Nvidia GeForce Now, and PlayStation Plus Premium work fundamentally differently from traditional online gaming. Instead of running the game locally on your device, the game runs on a remote server, and the video output is streamed to your screen in real time. Independent testing found that Xbox Cloud Gaming uses approximately 2.4–5 GB per hour, depending on resolution, while GeForce Now consumes between 4 GB and 16 GB per hour at higher-quality tiers.  

Cloud gaming data consumption is closer to 4K video streaming than to traditional online gaming. 

Service Resolution Approx. Data Per Hour 
Xbox Cloud Gaming 720p 2.5 GB/hr 
Xbox Cloud Gaming 1080p 3–5 GB/hr 
Xbox Cloud Gaming 1440p 6–8 GB/hr 
NVIDIA GeForce Now 1080p 4–9 GB/hr 
Nvidia GeForce Now 4K (Ultimate tier) 12–16 GB/hr 
PlayStation Plus Premium 1080p 4–8 GB/hr 
Sources: Xbox Cloud Gaming system requirements and Nvidia GeForce Now. 

Data cap reality check: On a 1 TB data cap, cloud gaming alone could consume your entire monthly allowance in under three weeks if you’re gaming daily at high quality. 

Tips for managing cloud gaming data: 

  • Use your service’s built-in data-saving mode. GeForce Now’s Data Saving mode can reduce consumption by up to 50%
  • Drop to 1080p instead of 4K. The visual difference is minimal on most screens, but the data savings are significant
  • Reserve cloud gaming for Wi-Fi connections. Cellular data plans are rarely suited for sustained cloud gaming sessions
  • Check whether your data cap has a gaming or streaming exemption. Some fixed wireless providers offer them

Game Downloads and Updates 

This is where gaming uses the most data. Modern games have grown dramatically in install size due to high-resolution textures, uncompressed audio, multiple language packs, and the bundling of multiple game modes (campaign, multiplayer, battle royale) into a single unified launcher. AAA games typically range from 80 GB to 130 GB for larger, more detailed titles, with some franchises far exceeding that ceiling. 

Game / Title Platform Approx. Download Size 
Call of Duty: Modern Warfare III PC 213 GB 
Call of Duty: Black Ops 6 PC 130 GB 
Red Dead Redemption 2 PC 150 GB 
Cyberpunk 2077 PC 70 GB 
Assassin’s Creed Shadows PC 100+ GB 
Fortnite PC 30–35 GB 
Microsoft Flight Simulator 2024 PC 50 GB (base) and streaming 
GTA V PC 100 GB 

Install sizes vary by platform (PC typically larger than console) and grow over time as seasonal updates and DLC are added. 

Major updates can be nearly as large as the original download. Some patches won’t take more than 1 GB, but games like Destiny 2 have patches that frequently come in at around 5 GB, and major content updates for games like Call of Duty have historically exceeded 50 GB in a single patch. 

Practical tips for managing game download data: 

  • Schedule downloads overnight. Most internet providers throttle speeds during peak hours (7–11 PM); overnight downloads are often faster and don’t compete with household streaming
  • Use wired Ethernet. Downloads are faster and more stable than Wi-Fi, which means less time the connection is active and consuming overhead data
  • Pause automatic updates. Steam, PlayStation Network, and Xbox all have settings to disable automatic background downloads; enable updates only when you’re on Wi-Fi or during off-peak hours
  • Download selectively. Most modern launchers (including Call of Duty HQ) let you install only the modes you play; skipping the campaign or Warzone content can save 30–60 GB
  • Monitor background launcher activity, Epic Games Launcher, Steam, and Xbox app all run background processes that download asset updates even when you’re not actively gaming

How Streaming and Gaming Affect Your Internet Plan 

Knowing how much data streaming and gaming use per hour is only half the picture. The other half is understanding how that consumption affects your data cap, your monthly total, and whether your connection can handle your household’s internet needs. 

ISP Data Caps — Which Providers Cap and Which Don’t 

Data caps vary by provider and internet connection type. The table below reflects current plan structures as of 2025, sourced from CableTV.com’s ISP data cap guide and provider documentation. 

Provider Data Cap Overage Policy 
AT&T Fiber Unlimited No caps or overage on fiber plans 
Xfinity Unlimited (new plans) New plans have no caps; existing/legacy plans may still have 1.2 TB cap — check your account 
Cox 1.25 TB/month $10 per 50 GB over cap (max ~$100/mo); unlimited add-on ~$50/mo 
Mediacom Unlimited No caps or overage fees on current plans (Internet 300, 1 Gig, 2 Gig) 
Spectrum Unlimited No caps, no overage charges 
Verizon Fios Unlimited No caps, no overage charges 
Frontier Fiber Unlimited No caps on fiber plans; satellite plans have data allowances 
Google Fiber Unlimited No caps, no overage charges 
Optimum / Astound Unlimited No hard caps; excessive use reviewed case-by-case 
EarthLink Unlimited (most plans) Some entry-level plans may have limits — verify at signup 
HughesNet Soft cap: 100–200 GB priority data No overage charges; unlimited standard data at reduced speeds (1–3 Mbps) after priority data is exhausted 
Viasat Soft cap: 150 GB (Essentials) / 850 GB (Unleashed) No overage charges; speeds deprioritized during peak hours after threshold 
Starlink Unlimited (most plans) No overage fees; may experience deprioritization during network congestion 

Hard caps vs. soft caps. Cox imposes a hard cap with overage charges; if you exceed 1.25 TB, you pay $10 per additional 50 GB. HughesNet and Viasat use soft caps, meaning you won’t be charged extra, but your speeds will slow significantly once you exhaust your priority data. The real-world effect is different: overage fees hurt your wallet; speed throttling hurts your streaming quality. Xfinity removed data caps from all new plans in June 2025, though customers on legacy plans may still have a 1.2 TB cap. Check your account to confirm which plan you’re on. 

Unlimited isn’t always unlimited. Several providers market unlimited data with strings attached. Viasat no longer has hard data caps, but its unlimited data isn’t fully unlimited. It can slow speeds during high-traffic periods once you near the monthly threshold, which is 150 GB for its Essentials plan and 850 GB for Unleashed. HughesNet works similarly: priority data allowances range from 100 GB to 200 GB depending on your plan, and once exhausted, you’re automatically moved to unlimited Standard Data, which continues to work but at significantly reduced speeds, typically 1–3 Mbps. For satellite internet users, “unlimited” refers to access, not performance. 

How Many GB Per Month Do You Use? 

Per-hour data figures are useful, but what most people actually need to know is: will I hit my data cap this month? The table below translates daily streaming habits into monthly estimates so you can check your usage against your plan’s limits at a glance. 

Daily Habit Quality Devices Est. Monthly Usage 
1 hr streaming/day HD (1080p) 1 90 GB/mo 
2 hrs streaming/day HD (1080p) 1 180 GB/mo 
3 hrs streaming/day HD (1080p) 1 270 GB/mo 
2 hrs streaming/day 4K 1 420 GB/mo 
3 hrs streaming/day 4K 1 630 GB/mo 
2 hrs streaming/day HD and 1 hr gaming/day 1 185 GB/mo 
2 hrs streaming/day HD (multiple devices) 2–3 360–540 GB/mo 
Mixed heavy household 4K, gaming, and downloads 3–4 700 GB–1 TB+/mo 
Cloud gaming 2 hrs/day 1080p 1 240–300 GB/mo (gaming alone) 

Real-world scenario: A household of four, where two people stream in HD for 2 hours each and one person streams in 4K for 2 hours each daily, will consume about 540–600 GB/month from streaming alone, before accounting for game downloads, video calls, or smart home devices. That puts them within range of Xfinity’s 1.2 TB cap under normal conditions, but a few large game updates or a month of cloud gaming could push them over. 

Note: These estimates reflect video streaming data only. Add 50–150 GB/month for moderate online gaming, and 50–215 GB per major game download or update. 

Streaming and Gaming on the Same Connection 

It’s not only about how much data you use, but also about whether your connection has enough speed to handle everything without anyone buffering or lagging. Speed and data are separate variables: a 1 TB data cap tells you how much you can use; your speed (Mbps) tells you how much you can do at once. 

The table below shows recommended download speeds for common household combinations. 

Household Scenario Recommended Speed 
1 person, HD streaming 10–15 Mbps 
1 person, 4K streaming 25 Mbps 
1 person, online gaming 10–25 Mbps 
2 people, HD streaming simultaneously 20–30 Mbps 
2 people, one streaming HD, and one gaming 30–50 Mbps 
Family of 4, mixed HD streaming, and gaming 100 Mbps 
Family of 4, 4K streaming, gaming, and video calls 200–300 Mbps 
Heavy household, cloud gaming, 4K, and downloads 300–500 Mbps 
Large household, multiple cloud gamers 500 Mbps–1 Gbps 
Sources: Netflix and FCC 

Your total potential speed is split across all devices connected to the network. A 25 Mbps plan may provide only 10–15 Mbps on any individual device, depending on how many devices are active. The more people and devices sharing a connection, the more headroom you need. As we mentioned above, latency is more important for gameplay than fast speeds. 

Home Internet vs. Mobile Data 

The difference between streaming on home Wi-Fi and streaming on cellular data comes down to cost, consistency, and data caps. 

Home internet is almost always the better option for streaming and gaming. Most home plans offer either unlimited data or caps of 1 TB or more, stable speeds, and no per-GB overage charges on mobile data. Wi-Fi connections also don’t count against your cellular plan’s data allowance. 

Mobile data is more expensive per GB, less stable, and typically far more limited. The average U.S. mobile plan offers 15–50 GB of high-speed data before throttling, which is enough for casual streaming but not for sustained household use. 

Factor Home Wi-Fi Cellular Data 
Typical data allowance 1 TB–Unlimited 15–50 GB (high-speed) 
Cost per GB Effectively fractions of a cent $5–$15/GB after cap 
Speed consistency High Variable (signal dependent) 
Latency Low (5–30ms on fiber/cable) Higher (30–70ms typical) 
Best for 4K streaming, gaming, downloads Short sessions, travel 

Stream and download over Wi-Fi whenever possible. Reserve cellular data for short sessions when no Wi-Fi is available, and use your streaming app’s offline download feature to cache content over Wi-Fi before traveling. 

What Speed Do You Need for Streaming and Gaming? 

Every major streaming platform publishes its own speed recommendations. The table below consolidates those official guidelines and adds a practical recommended column that accounts for real-world conditions such as other devices on the network, Wi-Fi overhead, and the gap between your plan’s advertised speed and what your device receives. 

Quality Resolution Platform Minimum Recommended (Real-World) Notes 
SD 480p 1–3 Mbps 5 Mbps Sufficient for mobile; poor on large screens 
HD 720p 3–5 Mbps 10 Mbps Allows headroom for other devices 
Full HD 1080p 5 Mbps 15–25 Mbps Most common default on smart TVs 
4K / UHD 2160p 15–25 Mbps 35–50 Mbps Netflix recommends 15 Mbps; real households need more 
8K 4320p 50+ Mbps 100+ Mbps Rare; few consumer services currently offer 8K 
Sources: Netflix Help Center, YouTube Support, Disney+ Help, Hulu Support, Amazon support documentation. 

Why the gap between minimum and recommended? Platform minimums assume a single device with a perfect wired connection and nothing else competing for bandwidth. The recommended column builds in the multi-device margin. 

Multi-device multiplier: If two people are streaming 4K simultaneously, double the recommended speed. Three 4K streams? Triple it. A household running three 4K streams plus active gaming and video calls realistically needs 100–200 Mbps or more of consistent throughput. 

Recommended Speeds for Online Gaming 

As mentioned earlier, latency is more important for gaming than speed. A good ping for gaming is 50 ms or less, but under 20 ms is considered ideal for competitive and fast-paced games.  

Gaming Type Min. Download Speed Recommended Speed Target Ping 
Competitive FPS/battle royale 3–5 Mbps 10–25 Mbps Under 100 ms 
Online multiplayer (console / PC) 5 Mbps 25 Mbps Under 50 ms 
Competitive FPS / battle royale 10 Mbps 50 Mbps Under 20 ms 
MMO / large-world multiplayer 10 Mbps 50–100 Mbps Under 50 ms 
Cloud gaming (1080p) 15–20 Mbps 35–50 Mbps Under 40 ms 
Cloud gaming (4K) 40 Mbps 75–100 Mbps Under 30 ms 

Connection type matters as much as speed. Fiber delivers typical ping times of 5–20ms. Cable runs 15–35ms. Fixed wireless is often 30–60ms. Low Earth orbit satellite internet averages 30–60ms at best, which is playable but not ideal for competitive gaming. 

Wired vs. Wi-Fi: For gaming, an Ethernet connection is always preferable to Wi-Fi. Wi-Fi introduces variable latency and interference that can cause ping spikes even on fast connections. If running a cable isn’t practical, use 5 GHz Wi-Fi and position your device as close to the router as possible. 

How to Test If Your Connection Can Handle Streaming and Gaming 

Speed plan figures are theoretical maximums under ideal conditions. What you get at your device at any given moment depends on network congestion, router quality, Wi-Fi signal strength, and how many devices are active on your connection. The only way to know your real-world performance is to test it. 

Run a free internet speed test to measure your current download speed, upload speed, and latency. For the most accurate results: 

  • Test over wired Ethernet if possible, not Wi-Fi; this shows your connection’s true ceiling
  • Test at peak hours (typically 7–10 PM) as well as off-peak; ISPs often deliver lower speeds during high-traffic periods
  • Test on multiple devices if you’re troubleshooting a specific device that’s buffering or lagging
  • Compare latency, not just speed; if your download speed looks fine but you’re experiencing gaming lag, your ping may be the problem

Once you have your results, compare them against the tables above. If your measured speed falls below the recommended threshold for your typical streaming quality or gaming setup, the issue is likely at the plan or connection level. If your speed looks adequate but you’re still experiencing problems, the culprit is usually Wi-Fi signal quality, router age, or network congestion from other devices. 

How to Reduce Your Streaming and Gaming Data Usage 

The single most effective thing you can do to lower your data consumption is adjust your streaming quality. It can cut usage by 50–70% with minimal visible impact on smaller screens. But there are several other tips that can help. 

Adjust Your Streaming Quality Settings 

Every major streaming platform lets you manually cap video quality, and most offer a data-saving mode. Lower resolution uses dramatically less data. Dropping from 4K to HD, for example, cuts per-hour consumption from about 7 GB to around 3 GB. Here’s how to do it on each major platform: 

How to adjust quality on Netflix: 

  1. Go to your account 
  1. Select Profile & Parental Controls 
  1. Select Playback Settings 
  1. Select Low, Medium, High, or Auto 

How to adjust quality on YouTube: 

  1. Click the gear icon on the video player 
  1. Select Quality 
  1. Select your preferred resolution 

How to adjust quality on Prime Video: 

  1. Go to Settings 
  1. Select Stream & Download 
  1. Select Streaming Quality 
  1. Choose Good, Better, or Best 

How to adjust quality on Disney+: 

  1. Go to your Profile icon 
  1. Select App Settings 
  1. Select Data Usage 
  1. Select your preferred option 

How to enable Data Saver on Hulu: 

  1. While watching, tap the gear icon 
  1. Select Data Saver 

How to adjust quality on Apple Music: 

  1. Settings 
  1. Music 
  1. Audio Quality 
  1. Select separately for cellular, Wi-Fi, and downloads 

How to adjust quality on Spotify: 

  1. Go to Settings 
  1. Select Audio Quality 
  1. Select streaming quality for Wi-Fi and cellular separately 

How to adjust quality on Twitch: 

  1. Go to the gear icon 
  1. Select your preferred quality 
  1. Select Apply 

Use Offline Downloads Strategically 

Downloading content over Wi-Fi for later offline playback is one of the most underused data-saving techniques available. When you download, you consume data once during the download, not every time you watch. For content you watch regularly, this can eliminate ongoing data usage entirely. 

Where to use it: Netflix, Amazon Prime Video, Disney+, Hulu, Spotify, and Apple Music all offer offline download features, but may require a paid subscription. 

Practical scenarios where downloading makes a real difference: 

  • Commuting or travel. Download your playlist or watch queue before leaving home, then stream nothing on cellular during transit
  • Flights. Most streaming services allow downloading for exactly this scenario: batch download before departure
  • Repeated plays. Playlists, podcasts, kids’ shows, or workout music you return to daily should always be downloaded, not streamed
  • Hotel and public Wi-Fi. If you’re on a trip and know you’ll have slow or unreliable Wi-Fi, pre-download on your home connection before you leave

How to download on major platforms: 

  • Netflix: Tap the download icon (arrow) on any compatible title while connected to Wi-Fi 
  • Disney+: Tap the download icon on any title; manage downloads under your profile 
  • Amazon Prime Video: Tap the download icon; adjust download quality under Settings, then Downloads 
  • Spotify: Toggle Download on any playlist or album while on Wi-Fi; enable Offline Mode to stop streaming entirely 

Data Monitoring Tools 

Before you can manage your data usage, you need to know where it’s going. Most people are surprised by which apps are the biggest culprits, and it’s often not the obvious ones. 

Start with your provider’s native tools. Most major providers offer a data usage dashboard in their account portal or app. Xfinity, Cox, AT&T, and HughesNet all provide real-time or near-real-time usage meters that show your total monthly consumption and how you’re tracking against your cap. This should be your first stop before any third-party app. 

Third-party monitoring apps can provide more granular, per-app breakdowns that your internet provider dashboard won’t show: 

  • My Data Manager: tracks usage across mobile, Wi-Fi, and roaming, with real-time alerts to help you avoid overage charges and manage your plan efficiently
  • GlassWire Data Usage Monitor: offers real-time network graphs and identifies which apps are consuming the most data; includes an optional firewall to block specific apps from using data; free with in-app purchases for additional features
  • Data Usage Monitor: automatically tracks usage from launch, provides threshold alerts, and offers a simple interface; free with ads
  • NetGuard: lets you block specific apps from accessing the internet, useful for preventing background data consumption from apps you rarely use actively
  • Data Counter Widget: adds a home screen widget for at-a-glance mobile and Wi-Fi usage monitoring; free

On your devices directly: 

  • iOS: Settings → Cellular → scroll down to see per-app cellular usage
  • Android: Settings → Network & Internet → Data Usage → see per-app breakdown and set data warnings
  • Windows: Settings → Network & Internet → Data Usage → set a data limit and view per-app consumption
  • Router admin panel: Most modern routers show per-device bandwidth usage which is useful for identifying which household device is consuming the most data

Wi-Fi vs. Cellular — When It Matters 

Stream and download over Wi-Fi whenever possible, and use cellular only as a backup for short sessions. For a full breakdown of home Wi-Fi vs. mobile data costs, speeds, and data allowances, see the Home Internet vs. Mobile Data section above. 

One exception worth noting: public Wi-Fi at airports, cafes, and hotels saves your cellular data but carries security risks. They are often unencrypted and vulnerable to interception. If you stream on public Wi-Fi, consider using a virtual private network (VPN) for added protection. 

How Streaming Technology Affects Data Usage 

Understanding the basics of how streaming works helps explain why two HD streams can use different amounts of data, and why your video quality sometimes drops automatically when your connection slows. 

How Adaptive Bitrate Streaming Works 

Adaptive bitrate (ABR) streaming continuously monitors your available bandwidth and adjusts video quality up or down in real time with no manual intervention required. If your connection slows due to congestion, Wi-Fi interference, or a device downloading in the background, the video drops to a lower resolution to prevent buffering, then climbs back up when your connection recovers. The momentary soft or blocky picture you sometimes see during peak hours is ABR doing its job. 

Every major platform uses ABR by default. The practical implication is that you may not always receive the highest quality your subscription supports, even when nominally streaming in 4K. 

Video Compression Codecs 

A codec compresses and decompresses video data. More efficient codecs deliver the same visual quality at lower data consumption, which is why data usage varies between platforms even at identical resolutions. 

H.264 is the most universally supported codec and the standard for HD streaming, but it’s the least efficient of the current generation. H.265/HEVC is roughly twice as efficient as H.264, making it well-suited for 4K, though licensing costs have slowed adoption. VP9, Google’s royalty-free alternative to H.265, is used extensively on YouTube and largely explains why YouTube’s 4K consumption (about 4 GB/hr) is lower than Netflix’s (around 7 GB/hr) at equivalent resolutions. AV1 is the newest generation. It’s more efficient than both H.265 and VP9, royalty-free, and currently rolling out on Netflix and YouTube for select 4K content. Over time, broader AV1 adoption should reduce per-hour data consumption across streaming platforms. 

The Future of Streaming and Data Usage 

Streaming technology and data policy are both moving fast. New network infrastructure, growing content libraries, evolving codec standards, and shifting regulatory priorities are all reshaping how much data households use and what it costs to use. Here’s where things stand heading into the next few years. 

5G and Mobile Streaming 

The continued rollout of 5G is making HD and 4K streaming on mobile more reliable, offering smoother playback, less buffering in crowded venues, and lower latency that benefits cloud gaming. The data usage implications cut both ways: better connections encourage more mobile streaming, but 5G’s greater efficiency reduces overhead per GB delivered. Fixed wireless access (FWA) over 5G infrastructure is also expanding as a home internet alternative in areas where fiber isn’t available, giving more households a viable, unlimited-data option. 

New Streaming Services and Rising Data Demand 

Average household data consumption continues to climb as more content migrates from broadcast TV to streaming platforms, particularly live sports. Live content uses more data than on-demand at equivalent resolutions because it can’t benefit from pre-buffering and advanced compression. As more live events move online, household data footprints will continue to grow regardless of how many subscriptions people have. 

Environmental Impact of Data Centers 

Data centers that power streaming platforms consumed approximately 240–340 TWh of electricity in 2022, representing around 1–1.3% of global final electricity demand. By 2024, that figure had grown to approximately 415 TWh (about 1.5% of global consumption), increasing at 12% per year over the preceding five years, largely driven by growth in AI infrastructure. The per-hour carbon footprint of streaming has declined as platforms shift to renewable energy and adopt more efficient codecs, but total environmental impact continues to grow with usage volume. Netflix has committed to halving its carbon emissions by 2030 and, from 2022 onwards, to match any remaining emissions by investing in natural climate solutions, with the target independently validated by the Science-Based Targets Initiative. Hulu migrated its data centers to a 100% renewable energy facility in Las Vegas in 2018, a move it said would eliminate 265,000 tons of carbon emissions annually. 

The most actionable step for eco-conscious viewers: stream in HD rather than 4K on smaller screens, where the difference is imperceptible, and download content for offline viewing instead of streaming it repeatedly. 

FCC Data Cap Regulation 

The FCC launched a formal Notice of Inquiry into the impacts of data caps on consumers in October 2024, with a comment period that closed in December 2024. The inquiry has not advanced under the current administration, and no rulemaking has followed. 

The most meaningful change for consumers has come from the market rather than regulation. Xfinity eliminated data caps on all new plans in June 2025, and Mediacom moved to unlimited data across its current lineup. Both were driven by competitive pressure from fiber and fixed wireless providers. The FCC’s Broadband Consumer Label requirement, which took effect in 2024, does require ISPs to clearly disclose data caps and overage policies at the point of sale. It’s worth checking that label before signing up for any new internet plan. 

Frequently Asked Questions: Streaming and Gaming Data Usage

How does streaming affect my internet speed?

Streaming consumes bandwidth, which means less is available for other devices and activities on your network. The impact depends on quality. 4K streaming uses up to 7 GB/hr and can noticeably slow other activities, while SD streaming at about 1 GB/hr has minimal effect. Having multiple people stream simultaneously multiplies the demand. 

What is the difference between buffering and lagging?

Buffering is when your video pauses to load more data and is usually caused by a slow or inconsistent internet connection that can’t keep up with the stream. Lagging is a delay or stutter in the video or audio caused by high latency, meaning data is taking too long to travel between your device and the server. Buffering is a data delivery problem; lagging is a timing problem. 

Can I watch Netflix or Disney+ without an internet connection?

Yes, Netflix, Disney+, Amazon Prime Video, and Hulu all allow you to download content to your device for offline viewing. Once downloaded over Wi-Fi, you can watch without any internet connection. This is especially useful for travel, commuting, or anywhere with unreliable or expensive mobile data.

How does VPN usage affect streaming and data usage?

A virtual private network (VPN) routes your traffic through an additional server, which can increase latency and reduce speeds depending on the server location and quality of the VPN. Data usage increases slightly due to encryption overhead, typically 5–15% more than streaming without a VPN. Many people use VPNs while streaming to access geo-restricted content, though major platforms like Netflix actively work to block VPN traffic.

How can I test my internet speed to ensure it supports streaming?

Run a free speed test at TestMySpeed.com to check your current download speed, upload speed, and latency. For HD streaming you need at least 5–10 Mbps; for 4K, aim for 25 Mbps or more per stream. If the speed test results meet those thresholds but you’re still buffering, the issue is likely Wi-Fi signal quality or network congestion from other devices. 

How much data does streaming use per month?

It depends on quality and daily viewing habits. Streaming one hour of HD per day uses roughly 90 GB per month; two hours of 4K per day adds up to around 420 GB. A household with multiple streamers across mixed quality settings can easily consume 500 GB to 1 TB or more monthly. Keep this in mind if your internet plan has a data cap.

How much data does gaming use per hour?

Traditional online multiplayer gaming uses far less data than most people expect, typically 40–300 MB per hour depending on the game. Cloud gaming is a completely different story: services like Xbox Cloud Gaming and GeForce Now stream full video output and use 3–16 GB per hour depending on resolution, comparable to 4K video streaming. 

What internet speed do I need for 4K streaming?

Netflix recommends a minimum of 15 Mbps for 4K, but in a real household with other devices active, 25–50 Mbps is a more reliable target for a single 4K stream. If multiple people are streaming in 4K simultaneously, multiply accordingly. Two 4K streams need at least 50 Mbps of clean, consistent throughput. 

Does streaming use more data than downloading?

They use approximately the same amount of data for equivalent content, but downloading is more efficient over time. You pay the data cost once and can watch repeatedly without using additional data. Streaming charges your data allowance every time you watch.

How do I stop Netflix or YouTube from using so much data?

Lower the video quality in each app’s settings. In Netflix, go to Account, then Profile, then Playback Settings and select Low or Medium. On YouTube, tap the gear icon during playback and choose a lower resolution. Enabling Data Saver mode where available will also limit quality automatically. Downloading content over Wi-Fi for offline viewing eliminates ongoing data consumption entirely for content you watch repeatedly.

Is cloud gaming more data-intensive than regular gaming?

Yes, significantly. Regular online gaming sends small data packets back and forth and uses 40–300 MB per hour. Cloud gaming streams the entire rendered game as a video feed to your screen, consuming 3–16 GB per hour, which is 10 to 50 times more data. If you’re on a capped internet plan, cloud gaming is one of the fastest ways to hit your monthly limit.

How much data does a household of 4 use streaming per month?

A family of four streaming an average of two hours per day each, two in HD, two in 4K, will consume roughly 540–600 GB per month from streaming alone, before accounting for gaming, downloads, video calls, or smart home devices. That puts most households within range of a 1 TB data cap under normal conditions, with large game downloads or cloud gaming sessions capable of pushing them over.