Let’s face it; we all know that internet costs are rising, but for many customers, connection speeds aren’t keeping up. That means you’re likely paying a premium price for a high-speed plan, yet you still find yourself staring at a buffering wheel during your favorite show or freezing during a crucial Zoom call. In 2025, with more devices connected than ever before, like smart fridges to VR headsets, a consistent connection isn’t just a luxury; it’s a necessity.
The only way to know for sure if you’re getting what you pay for is to test, compare, and track your internet performance. Don’t let your ISP (Internet Service Provider) off the hook.
Check out your current speed by running a free internet speed test.
Key Takeaways
- Establish a Baseline: Regular speed tests reveal when your connection is underperforming compared to your “normal.”
- Test Everywhere: Testing in multiple rooms helps diagnose if the issue is your Wi-Fi router or the ISP connection coming into your home.
- Compare to Your Plan: Check if your actual speeds match the “up to” speeds promised on your bill.
- Keep a Log: A history of poor results is your best weapon when negotiating with your ISP.
- Try Simple Fixes: Sometimes, moving a router or updating firmware can fix speeds without costing a dime.
What You’re Actually Paying For (and Why Real Speeds Don’t Always Match)
When you signed up for your internet plan, you probably saw a big number like “1 Gig” or “500 Mbps.” But there’s a catch: ISPs almost always advertise “up to” speeds. This means that under perfect, laboratory conditions, that’s the speed you could get. Real-world conditions are rarely perfect.
Factors That Impact Actual Speeds
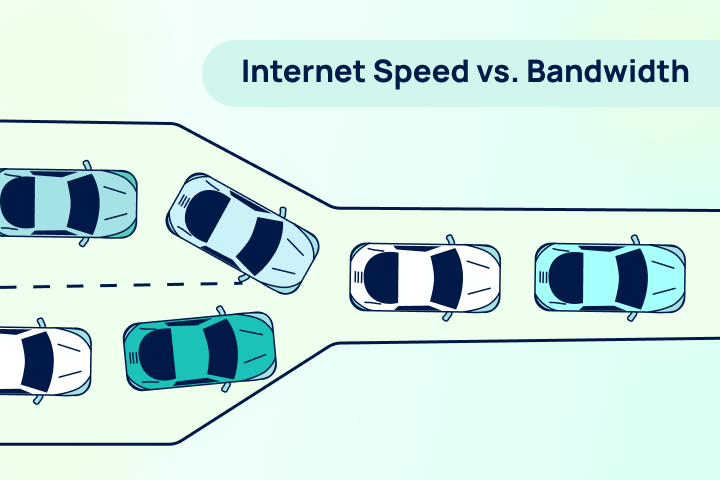
- Congestion: Just like rush hour traffic, if everyone in your neighborhood is streaming 4K video at 8 PM, speeds will drop. Learn how internet traffic affects speed.
- Wi-Fi Interference: Walls, microwaves, and even your neighbor’s Wi-Fi can interfere with your signal.
- Outdated Hardware: An old router can’t handle the speeds of modern fiber connections.
- Throttling: Sometimes, ISPs intentionally slow down specific types of traffic. Check if your ISP is throttling you.
Quick Definitions
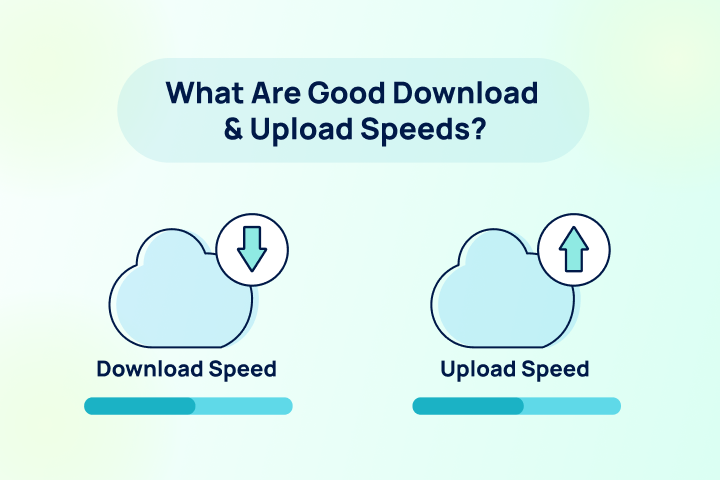
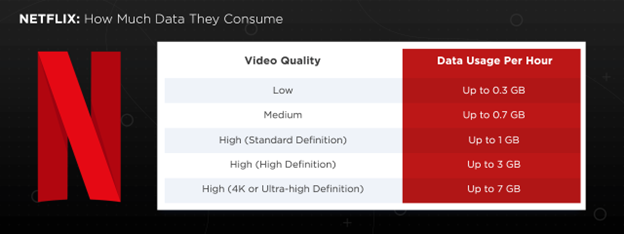
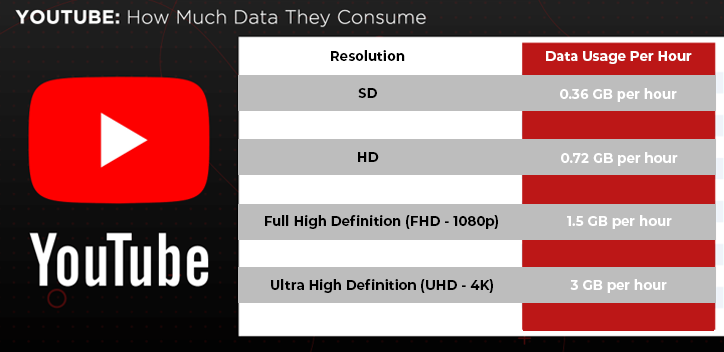
- Download Speed: How fast you pull data from the internet (loading web pages, streaming Netflix).
- Upload Speed: How fast you send data to the internet (posting to Instagram, your video feed on Zoom).
- Latency (Ping): The reaction time of your connection. High latency causes lag in gaming.
- Jitter: The variation in latency over time. High jitter causes choppy voice and video calls.
| Term | What it Affects | Good Range |
| Download Speed | Streaming, browsing | 100+ Mbps |
| Upload Speed | Video calls, gaming | 10-20+ Mbps |
| Latency | Gaming response time | < 50 ms |
| Jitter | Call smoothness | < 30 ms |
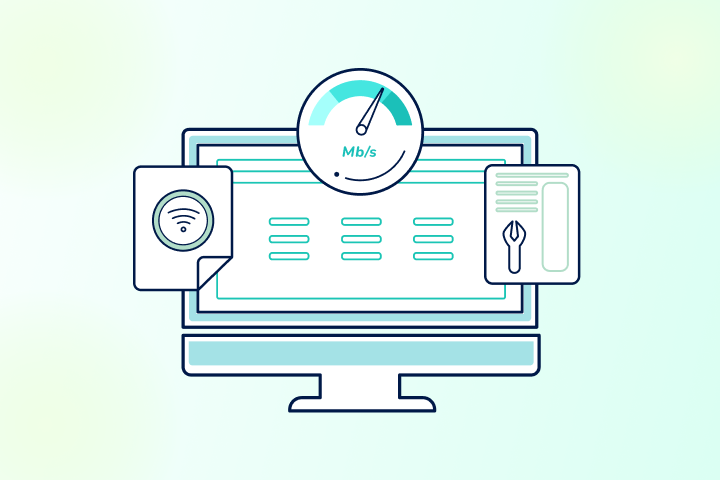
Step 1: Establish Your Baseline Internet Performance
Test Your Speed Correctly
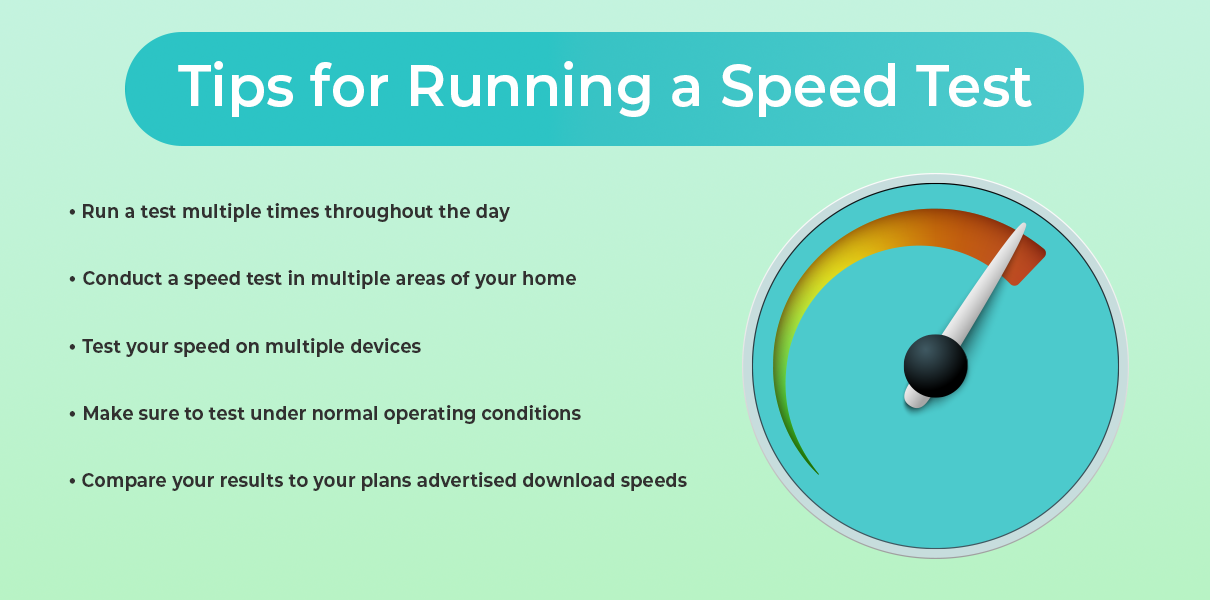
You can’t fix what you don’t measure. To get an accurate picture, you need more than just one test.
- Test at different times: Speeds often dip in the evenings.
- Compare Wired vs. Wi-Fi: If possible, plug a computer directly into your router with an ethernet cable. This tells you the true speed coming into your house, ruling out Wi-Fi interference.
- Test multiple devices: If your phone is slow but your laptop is fast, the issue might be the phone.
Identify Wi-Fi Weak Spots
Walk around your home and run a test in every room. You might find that the living room is blazing fast, but the bedroom is a dead zone.
- Location-based issues: If speeds drop only in the back office, you might need a Wi-Fi extender or a mesh system.
- Device-based issues: If only your old tablet is slow everywhere, it’s time for an upgrade.
- See our guide on Internet Connection Types to understand how your specific tech limits speed.
Step 2: Compare Your Results to Your Plan
Check Whether You’re Getting the Speeds You Pay For
Grab your latest bill or log into your ISP account. Find the “advertised speed” for your plan. Now, look at your internet speed test results.
- The Reality Check: If you pay for 500 Mbps but consistently get 50 Mbps over a wired connection, you have a serious problem.
- Reasonable Variation: Getting 450 Mbps on a 500 Mbps plan is normal. Getting 100 Mbps is not.
Evaluate Whether You’re Overpaying
Are you paying for “Gigabit” speed (1000 Mbps) but only using the internet to check email and watch YouTube? You might be overpaying.
| Household Size | Activity Level | Recommended Speed |
| 1-2 People | Web browsing, Email | 50-100 Mbps |
| 2-4 People | HD Streaming, Zoom calls | 200-400 Mbps |
| 4+ People | 4K Streaming, Gaming | 500+ Mbps (Gigabit) |
Step 3: Document Speed Issues for ISP Discussions
If you call your ISP and say, “my internet feels slow,” they might just tell you to reboot your modem. If you say, “I’ve tested my speed every day for a week at 7 PM, and I’m getting 20 Mbps when I pay for 200,” they have to listen.
- What to record: Date, Time, Speed (Mbps), and whether you were on Wi-Fi or wired.
- Why it matters: This log is your evidence for requesting bill credits or a technician visit.
Step 4: Determine Whether It’s Your Network or Your Provider
If Multiple Devices Are Slow → Network/ISP Issue
If your TV, phone, and laptop are all buffering, the problem is likely the router or the service coming from the street.
If Only One Device Is Slow → Device Issue
If your PS5 is lagging but Netflix works fine on the TV, check the PS5’s settings or location.
Check for Regional Outages
Before you spend hours troubleshooting, check if your whole neighborhood is down. Sites like Downdetector or your ISP’s app can show service outages.
Step 5: Use Your Data to Negotiate or Switch Providers
Armed with your data, call your ISP.
- Ask specific questions: “I see consistently high latency in the evenings. Is there node congestion in my area?”
- Demand value: “I’m getting half the speed I pay for. Can you lower my bill or fix the line?”
- Know when to fold ’em: If they can’t fix it, check to see if fiber internet or 5G home internet is available near you.
Avoid Overpaying for Internet You Don’t Need
Marketing departments love to sell you the fastest, most expensive package. But do you need it? Gigabit internet is amazing, but overkill for a couple who just browse Facebook. Use your test history to see your actual usage needs and “right-size” your plan to save money.
Troubleshooting Checklist
Before you sit on hold for an hour, try these quick fixes:
- Restart Everything: Unplug your modem and router for 30 seconds. It fixes 90% of problems.
- Update Firmware: Log into your router admin page and check for updates.
- Move Your Router: Get it out of the closet! Ideally, it should be central and high up.
- Replace Old Cables: That yellow ethernet cable from 2010 might be slowing you down.
- Reduce Traffic: Disconnect devices you aren’t using.
Get the Speeds You Pay For, Every Time
You work hard for your money, and your internet connection is vital for modern life. Don’t settle for sluggish speeds. By monitoring and testing regularly, you protect yourself from overpaying and ensure you have the bandwidth you need for work, play, and everything in between.
Verify your speed today with TestMySpeed
FAQs: Internet Speed
How do I know if I’m getting the speeds I pay for?
Compare the “Download Mbps” result from a speed test to the speed listed on your monthly internet bill. If the test result is significantly lower (e.g., 50% less) consistently, you aren’t getting what you pay for.
Why are my speeds slower than advertised?
“Advertised” speeds are maximums. Real speeds are lowered by Wi-Fi interference, network congestion (traffic), old routers, and distance from the ISP hub.
What internet speed does my home actually need?
For a family of 4 streaming video and working from home, 500 Mbps is a safe bet. A single person can usually get by just fine with 100 Mbps.
How often should I test my internet speed?
We recommend testing once a month to ensure consistency, or immediately any time you notice buffering or lag.